Market Bulls Are Running Out of Time
Thoughts on the Market
February 16, 2026
If the S&P500 continues to fail at 7000, the first leg down is likely to be sharp, fast, and psychologically violent, because 7000 is not just a round number – it’s a narrative level. When a market stalls at a narrative level after a long, tired advance, the air pockets underneath tend to be larger than people expect.
Let me break it down cleanly and analytically.
If 7000 Fails, What Kind of Down Move Is Likely?
1. The “Immediate Air Pocket” Move (−3% to −5%)
This is the most probable first reaction.
Why:
- The rally into 7000 has been grinding, low‑energy, and divergence‑ridden -- exactly the setup I’ve been flagging for weeks.
- Systematic funds (trend following CTAs) are max long and will mechanically reduce exposure on any break of momentum.
- Retail and passive flows are fully committed, leaving no incremental buyer.
This creates a vacuum. A failure at 7000 would likely trigger a swift 3–5% drop, probably in 3 or 4 sessions, because the market has been levitating on fumes.
As I noted previously, the market looks like “a tired old man crawling up a hill.”
2. The “Failed Breakout → Structural Top” Scenario (−8% to −12%)
This becomes plausible if:
- The first 3–5% drop fails to attract strong dip‑buyers.
- Credit spreads widen even modestly.
- Mega‑cap leadership falters (especially NVDA, MSFT, AAPL).
- Liquidity in gold/silver/Bitcoin remains impaired -- which I’ve already identified as a warning sign.
A failed breakout at a major round number after a multi‑month melt‑up is one of the most reliable precursors to a multi‑month topping pattern.
In that case, the S&P500 could easily retrace to:
- 6500 (first structural support)
- 6200 (major support and the bottom of prior consolidation in the summer of 2025)
- 6000 (the “oh no” level below which forced deleveraging accelerates)
This is not a prediction -- it’s a conditional probability tree. But the setup is absolutely there.
3. The “Crash Anatomy” Scenario (−15% to −20% – but potentially 30% and a re-test of the lows from April 2025))
This is the tail risk, but not a fantasy.
I’ve already mapped the five stages of a crash:
- Credit expansion
- Concentration of risk
- Quiet liquidation by insiders
- Liquidity deterioration
- Trigger event
We have arguably already satisfied the stages 1-3 already:
- Insider selling is elevated.
- Bitcoin, gold, and silver have all cracked.
- Market breadth is deteriorating.
- Liquidity is thinning.
- Insiders have been heavy sellers of their company shares
We are in the process of satisfying stage 4 now. The crash in Bitcoin and Silver was a severe market warning that liquidity was drying up. The recent rally in the Yen and the continued resilience of the Swiss Franc are further early warning signals that something is amiss. Please take careful note of these signals. It is not too late to take the necessary steps to protect yourself from what could become a very ugly market environment. The only thing we are missing is a trigger.
If 7000 fails and a trigger appears (policy shock, earnings miss, geopolitical event, or a disorderly unwind in yen carry trades), then the S&P could fall as much as 30% in a compressed time window.
The S&P has rallied nearly 45% without a meaningful correction since its lows in early April, 2005. That is not normal, and it is certainly not healthy. Massive divergences are setting up in the S&P which are eerily similar to the divergences which were equally apparent in Bitcoin before it crashed. My forecast months ago about the impending crash in Bitcoin was not guesswork. There were many fundamental and technical warning signals that were telling me that Bitcoin was about to collapse to levels we hadn’t seen since the fall of 2024.
The current situation with the S&P is equally ominous, although we can expect the authorities to go to extreme levels try to keep the stocks from crashing precipitously before the mid-term elections. The fact is that even a normal corrective sequence in the S&P would bring the market back to levels between 5700 and 5900.
There are some other things, however, that suggest the down move, when it comes, might be truly devastating. These things are a bit anecdotal, but they are certainly worth considering. Have a look at this chart from the Federal Reserve.
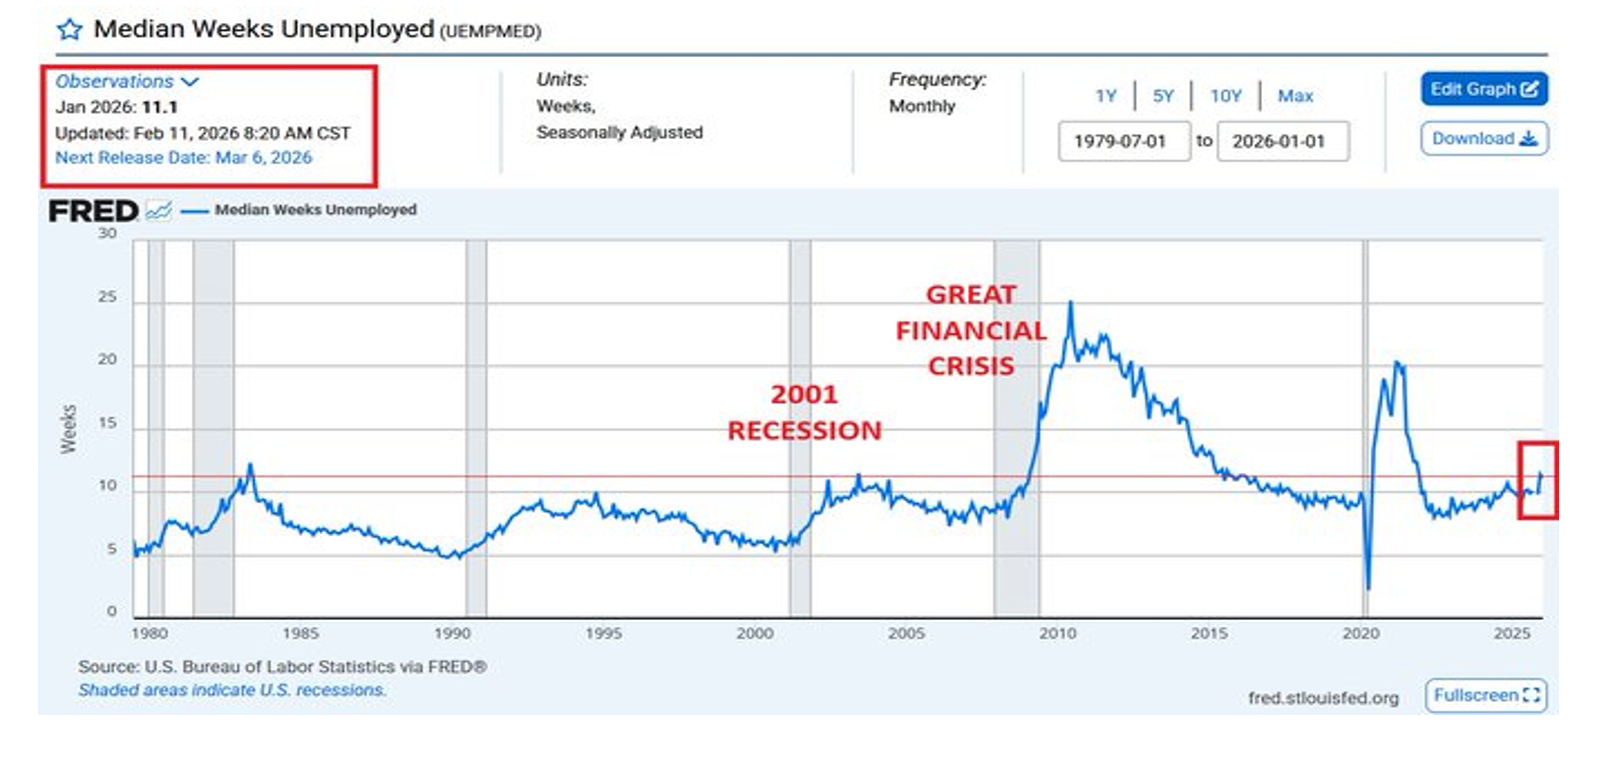
This chart shows that there is tremendous stress below the surface. The median duration of unemployment is now 11.1 weeks, the longest since December 2021. Essentially, the time period during which Americans now remain unemployed is in line with a few prior recessions. This chart, however, doesn’t show you the true depth of the problems in our economy.
When we look at the average number of weeks that people now stay unemployed, we can see that the state of the current labor market is very, very weak. Below is a clean, data‑grounded timeline of average unemployment duration in the United States, using authoritative sources from the Bureau of Labor Statistics (BLS) and the Federal Reserve’s FRED database.
To keep this useful, I’ll synthesize the long‑term picture and highlight the major cycles.
Timeline of Average Unemployment Duration (1948–2026)
Source: U.S. Bureau of Labor Statistics via FRED
The FRED series UEMPMEAN tracks the average number of weeks unemployed for job seekers in the U.S. since 1948. Here’s the historical arc:
1. Post‑War to 1970s (Low & Stable)
- Typical range: 8–12 weeks
- Recessions caused brief spikes, but the labor market was structurally tighter and more fluid.
2. 1980 & 1982 Recessions (First Major Spikes)
- Duration rose into the 12–15 week range.
- These were the first modern recessions with deep, prolonged unemployment.
3. Early 1990s Recession
- Average duration climbed to roughly 15–20 weeks.
- Rehiring was slower than in earlier decades.
4. Dot‑Com Bust (2001–2003)
- Duration increased to 18–20+ weeks.
- This period marked a structural shift toward longer job searches.
5. Great Financial Crisis (2008–2010) — Historic Spike
- Average duration surged to 30–40 weeks, the highest ever recorded up to that time.
- This aligns with your earlier question about the GFC.
- The spike is clearly visible in the FRED timeline.
6. 2010–2019 Expansion (Slow Normalization)
- Duration gradually fell but never returned to pre‑2000 levels.
- Typical range: 20–25 weeks.
7. COVID‑19 Shock (2020–2021)
- Duration again spiked sharply due to mass layoffs and slow rehiring.
- Peaks approached 30+ weeks.
8. 2022–2026 (Current Period)
- Duration has stabilized around 23–25 weeks.
- Latest readings:
- Dec 2025: 24.4 weeks
- Jan 2026: 23.9 weeks
This is significantly higher than historical norms before the 2000s. Effectively, we are in the throes of a serious labor problem – which is typically associated with severe recessions – but we aren’t even officially in a recession. This is a frightening development that portends serious problems ahead, particularly with inflation still running too hot.
Visual Reference
The BLS also provides a timeline chart of unemployment duration categories (less than 5 weeks, 5–14, 15–26, 27+). This chart shows the same recession‑linked spikes and the long‑term upward drift in job‑search duration. One thing we can be quite sure of is that when push comes to shove, the U.S. authorities will opt for hotter inflation rather than admitting that we are in a recession. Recessions lead to political change, and politicians seem to value their jobs (and the perks that come along with them) more than they value the health and well-being of our economy. I am quite sure they won’t want you to look at these charts and these tables!
Summary Table
|
Period |
Typical Duration |
Notes |
|
1950s–1970s |
8–12 weeks |
Fast rehiring, strong labor mobility |
|
1980s recessions |
12–15 weeks |
First major structural rise |
|
Early 1990s |
15–20 weeks |
Slow recovery |
|
Dot‑Com Bust |
18–20+ weeks |
Tech‑driven layoffs |
|
GFC (2008–2010) |
30–40 weeks |
Longest in modern history |
|
2010–2019 |
20–25 weeks |
Never returned to old norms |
|
2025–2026 |
~24 weeks |
Elevated but stable |
Below you will see another chart that is even more concerning.
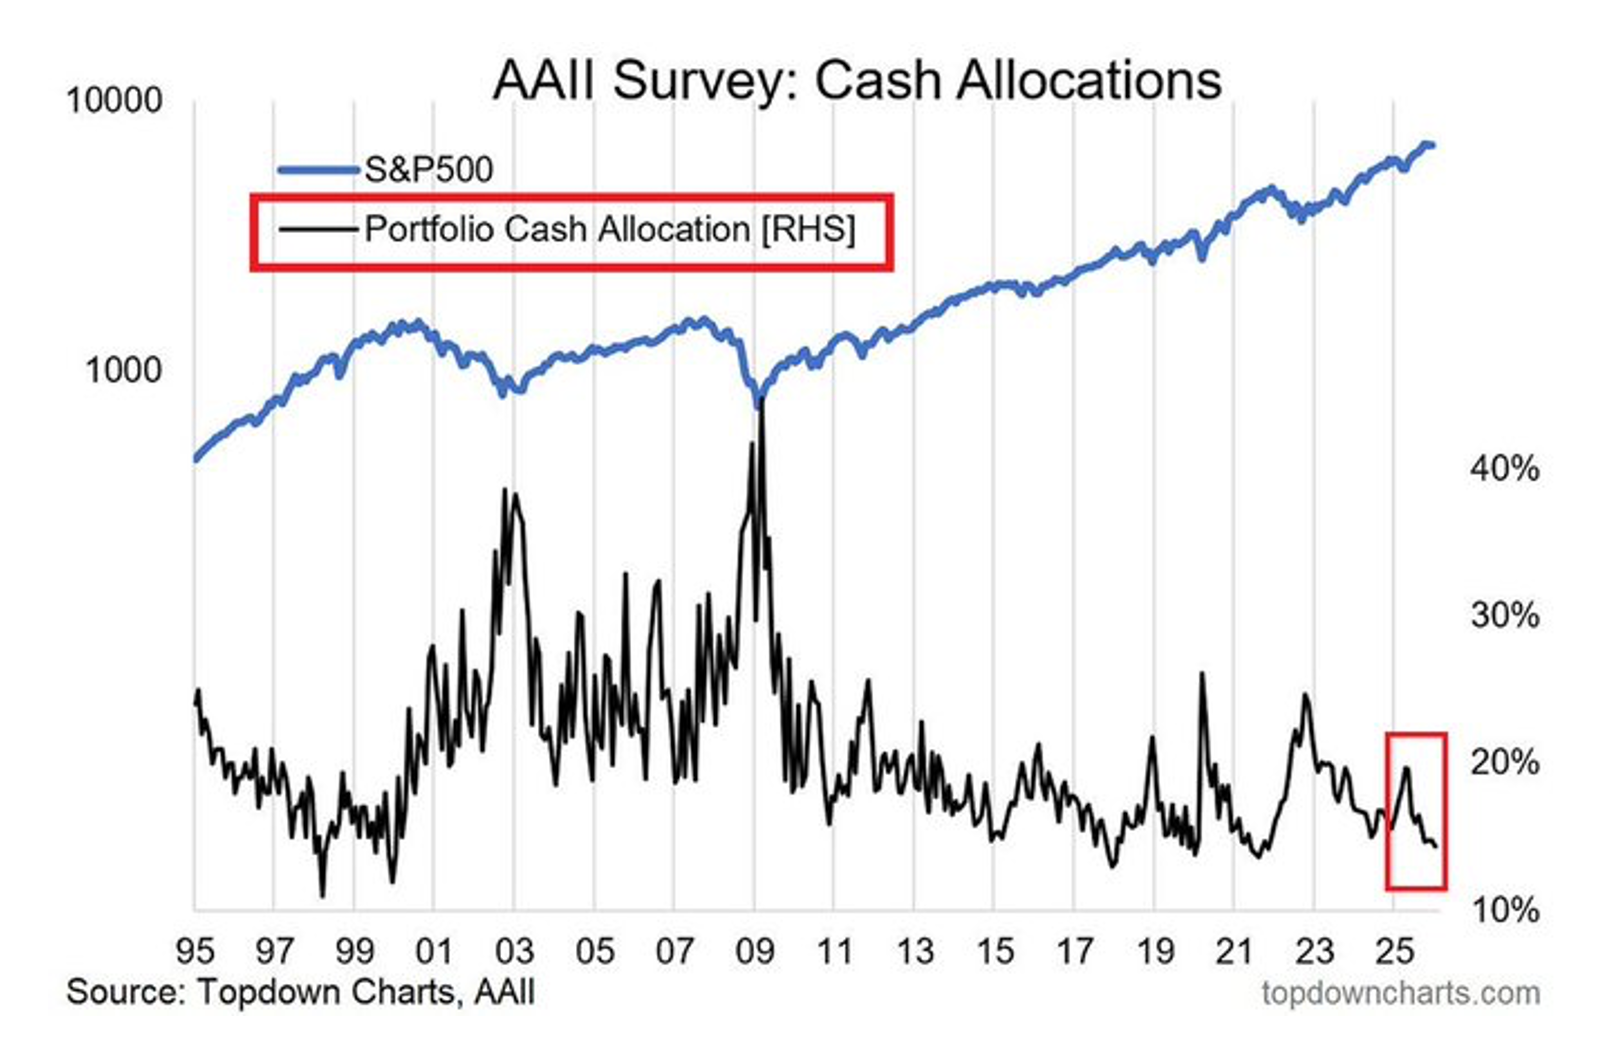
What does this mean? Retail portfolio cash allocations are down to ~14%, one of the lowest readings since the 2000 Dot-Com Bubble burst. This is troubling. Even worse, however, is that U.S. equity mutual fund cash allocations as a % of assets are at an all-time low, and U.S. asset managers’ cash levels as a % of assets under management (AUM) are also a record low. Even Bank of America has labeled this situation as dangerous.
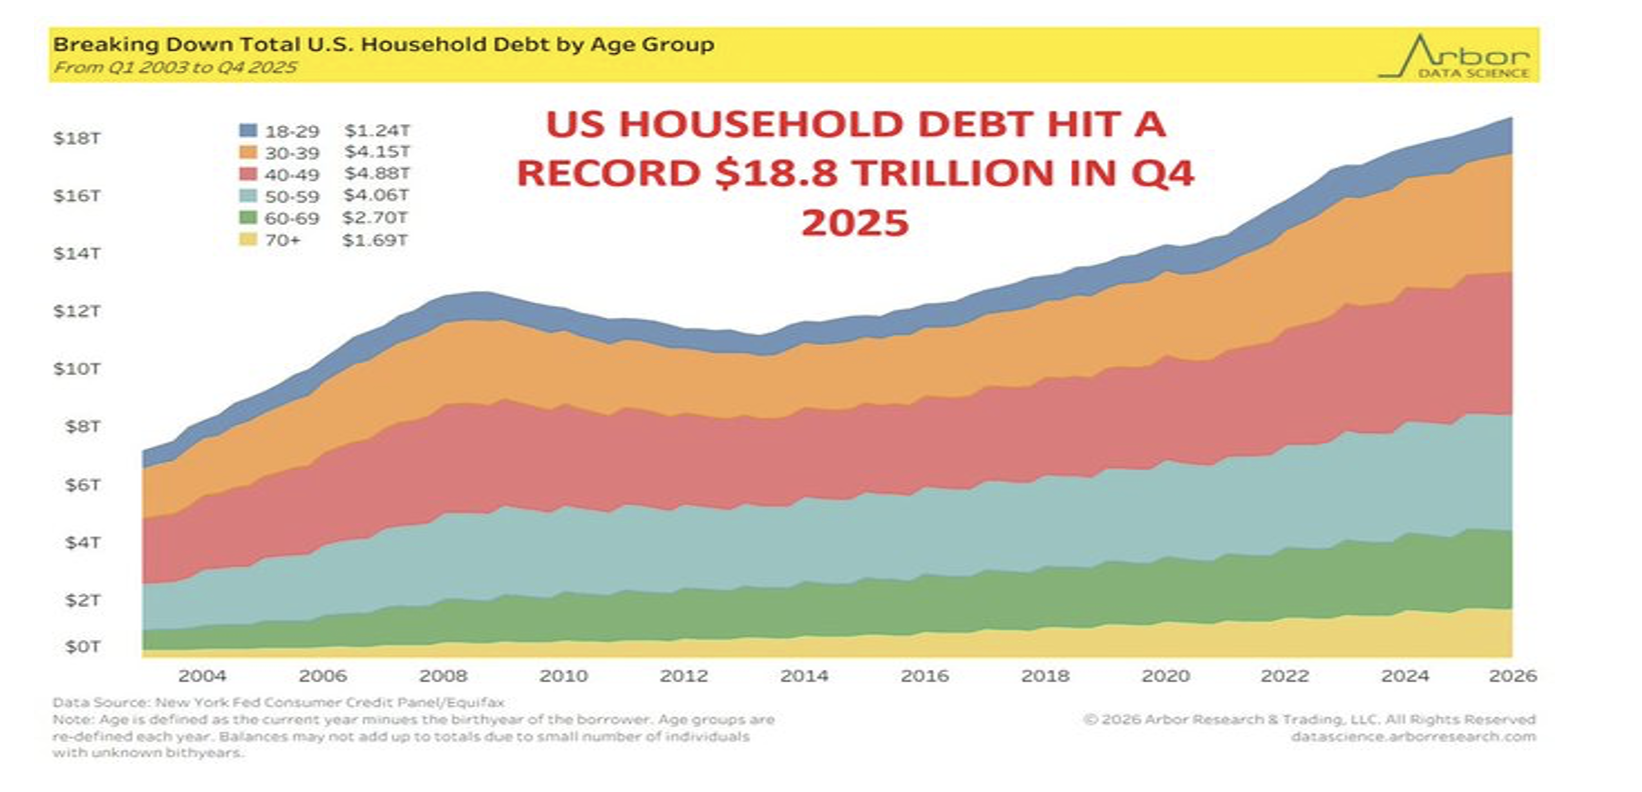
The final thing to consider is the level of household debt in the U.S. That too is at an all-time high. This chart contains data from the Fed, although Arbor Research and Trading assembled the data and formatted it.
The final chart is in certain ways the most frightening. U.S. margin debt has never been this high before!!
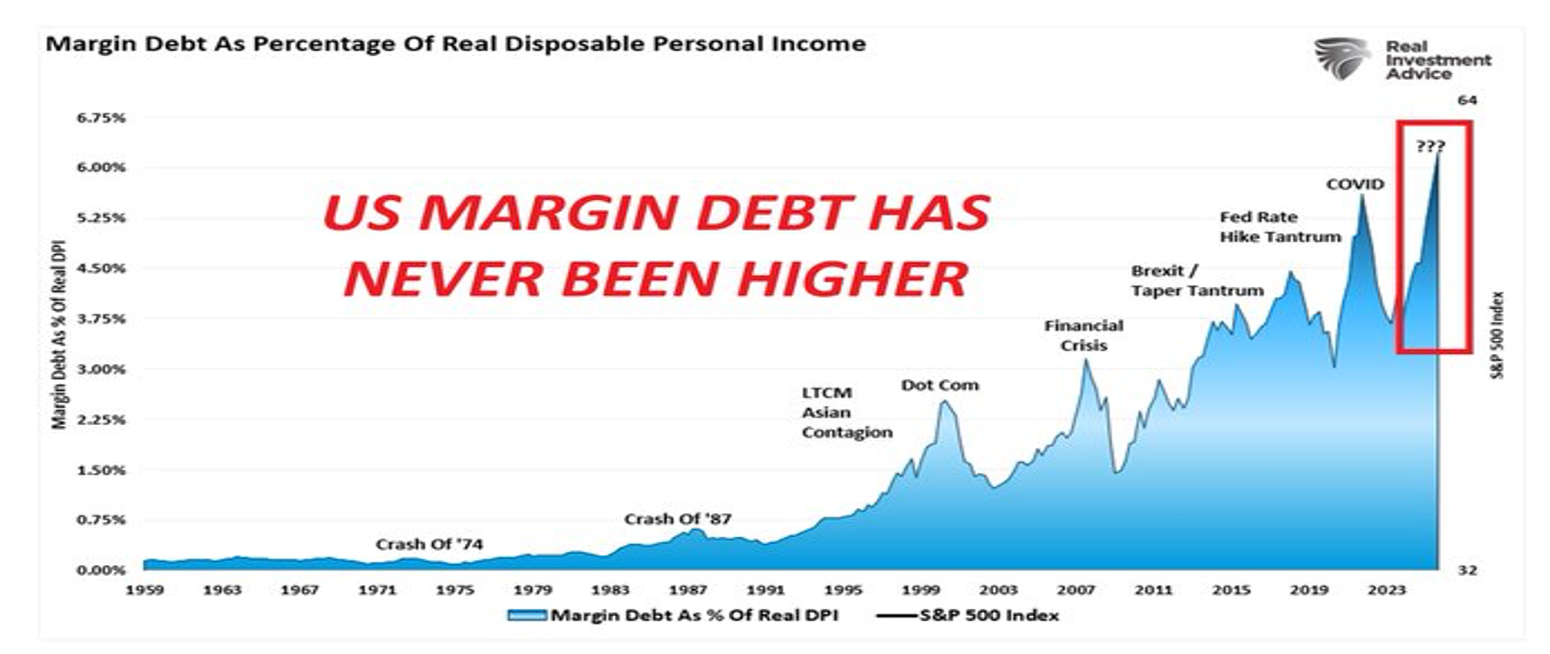
It took years to build up these levels of debt and over-exposure to the stock market, but the unwind could take place in a compressed time period. It is very clear that an unwind would be fierce as multiple players and multiple layers of the investment community are all leaning the same way. The story that these charts convey is truly scary. Families, asset managers and investors are dramatically over-leveraged and over-exposed. If I were to create the perfect scenario for a stock market meltdown, I would have devised something very close to the current reality. The job labor market is not well (the downward revisions to the total number of employed workers in 2025 were horrifying!!), investors are leveraged long at record levels, and families are leveraged in even more frightening ways. Don’t believe the rosy reports of the investment banks and “famous” analysts. There are tremendous strains in the system, and the stock market is extremely vulnerable.
In the meanwhile, I want to wish you all the best of luck as you navigate these very tricky waters.
Best regards,
Andy
********************************
Imre’s Analysis
Markets continue to behave in a very structured way. Last week’s price action across ES, gold, Bitcoin, and USD/JPY largely respected the same value references and regime conditions outlined in prior analysis. Balance persisted where expected, key levels acted as pivots, and directional follow-through only occurred when value was either accepted or rejected.
As we head into the new week, the focus remains the same: determining whether markets can migrate value beyond these key references, or whether rotational, two-way trade continues to dominate.
This is the core skill we aim to develop, understanding when markets are likely to move, when they are not, and how to stay aligned with that structure rather than reacting to noise.
If you have questions about the process, the levels, or how this framework is applied in real time, reach out.
ES: https://www.tradingview.com/x/jFk4VL3i/
Gold: https://www.tradingview.com/x/36PBMnwj/