An Increasingly Risky Economic Picture
In recent years, the Fed engineered a massive boom with the largest money supply increase in percentage terms since World War II. Are we going to have the bust to follow?
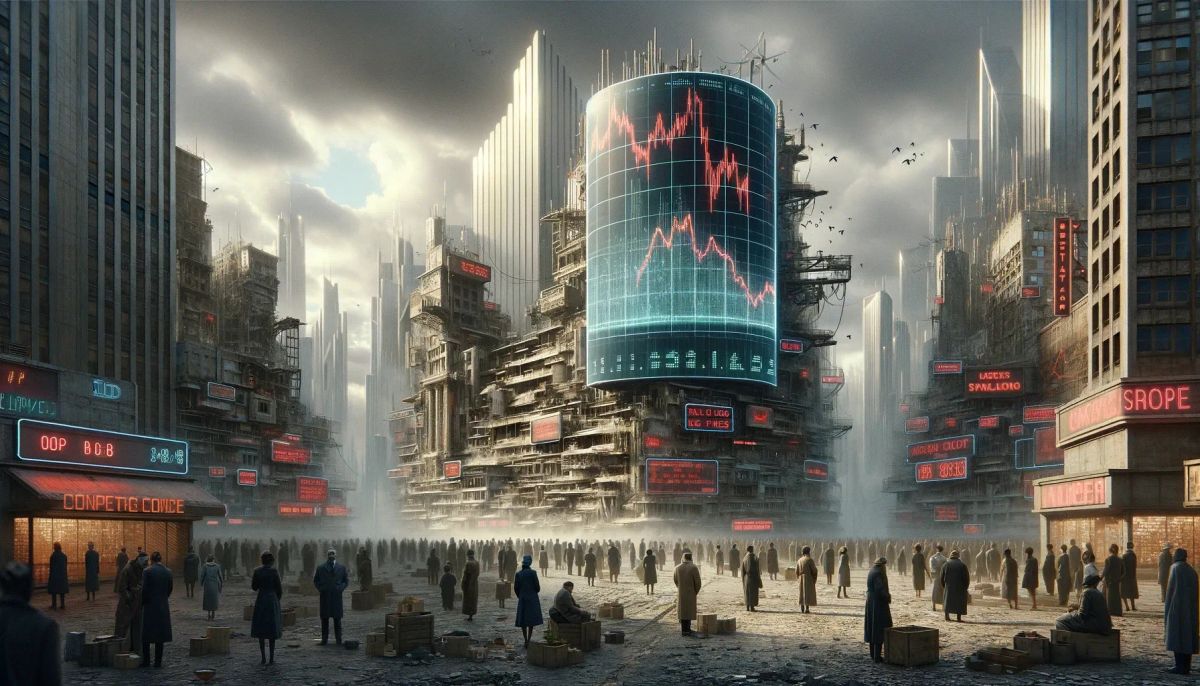
The stock market continues its strange journey. Frankly, the indices are highly misleading in that their volatility has been quite subdued, while the underlying activity of the individual components has been anything but calm. The broader S&P500 index is having a great year, but its performance has been highly distorted by the Magnificent Seven, which collectively have had a great run until very recently.
Even this is misleading, however, as very recently the Magnificent Seven haven’t been so magnificent. Alphabet and Apple are down more than 10% from their recent highs, META is down about 8%, Tesla is down 40% from its highs last summer, Amazon and Microsoft are down about 4% from their recent highs, while Nvidia is up about 85% on the year. Combined they comprise almost 30% of the S&P500, so their performance distorts the overall performance of the broader market.
This past Friday we saw some price action in Nvidia, the superstar of this group, that was truly astonishing. With no real economic news, Nvidia shot up 5% in early trading before dropping 13.5% in a violent sell-off. That might be more understandable in penny stocks, but Nvidia has a market cap of roughly $2.2 trillion!! There is nothing “normal” about this sort of market behavior in terms of economic fundamentals. As I have pointed out in previous write-ups, this market is being driven by wild, speculative, momentum-based energy, and this crazy market behavior might continue for a while. Modest market corrections will not stop this frenzy. It will take something far more dramatic to force people back to their senses.
As we learned in 2000 and 2008, speculative price action can push markets a long, long way, and drive things to totally distorted valuations. Stepping in front of highly speculative, momentum-based markets can be a very dangerous strategy unless you are very skilled and know how to structure limited-risk option strategies to play for reversals.
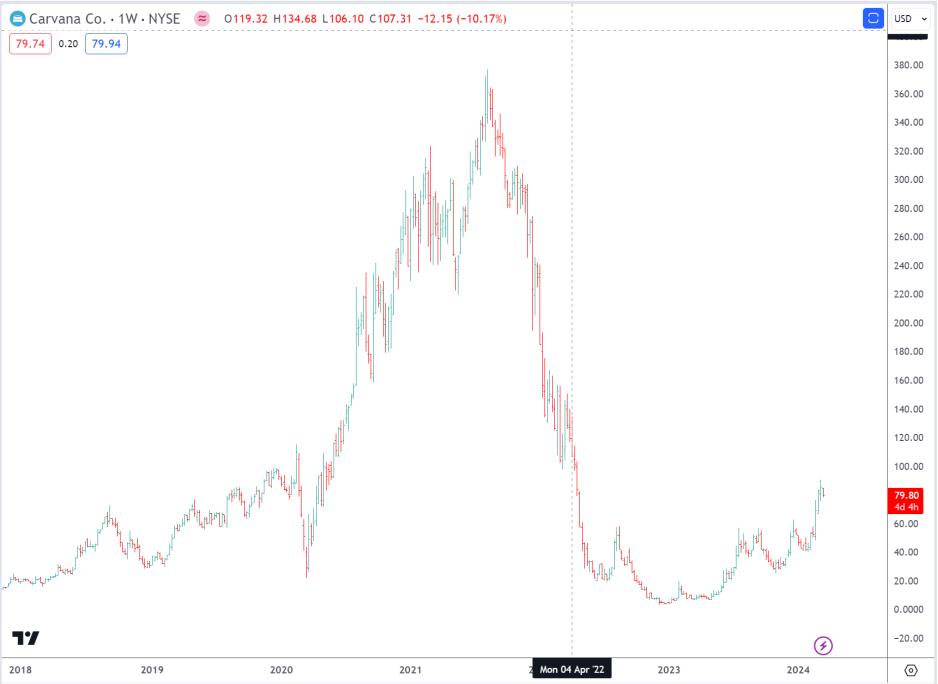
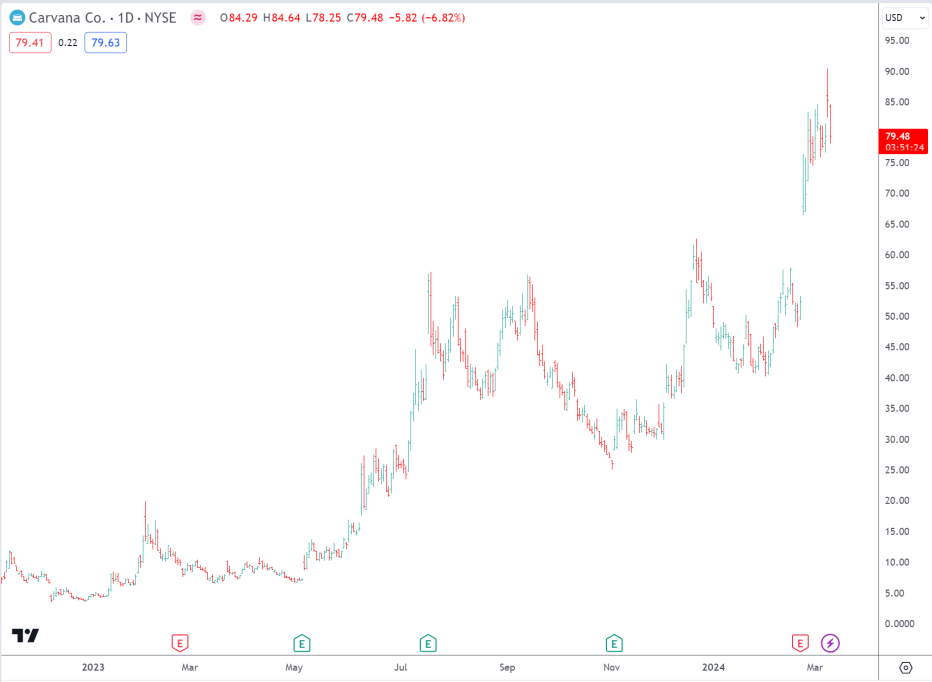
The current environment shares many characteristics of a wild mob, as it is essentially a wild mob mentality that is required to push a de facto bankrupt stock like Carvana higher until it has risen 2200% from its recent lows!! That’s right. Carvana shares dropped 99% from their highs, and the company was effectively bankrupt. Since then, its stock has exploded higher from $3.78 to $80.00. Why? My cynical explanation: more buyers than sellers. Why are they buying? Because the price is going up, attracting still more speculative players. Forget earnings. Forget balance sheets. This is a perfect example of too much liquidity in the system chasing after dumb ideas. As you will see in the economic figures below, Carvana’s earnings and balance sheet don’t justify price action remotely similar to what we are experiencing.
How will it end? Most likely, it will end in tears. The shorts already got steamrolled over when the stock burst higher, and the longs will likely get equally crushed when the stock crashes back down again. In the chart below, you can see how the stock crashed after reaching ridiculously overvalued levels.
In the chart below, you can see how it has risen up from the ashes.
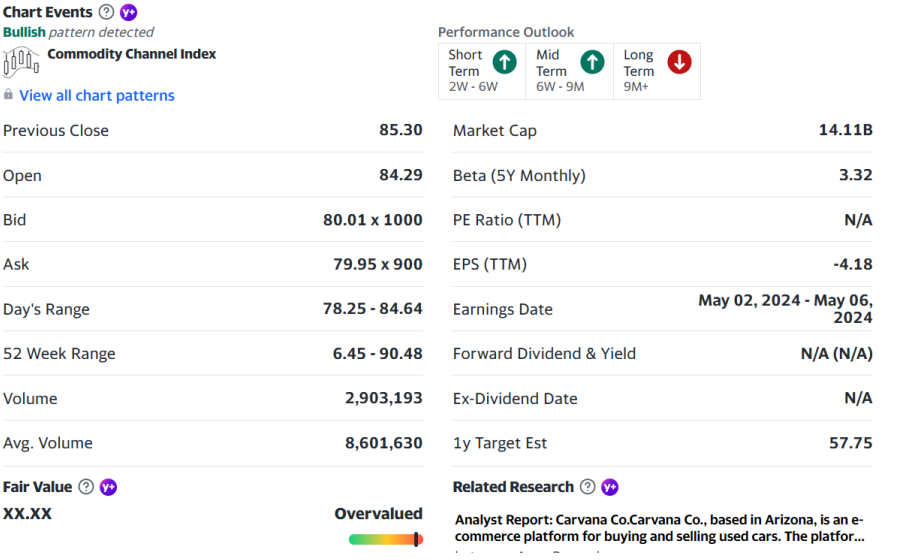
The company’s revenues have been on a downward trajectory. It loses money, so its PE ratio is immeasurable. Still, its market capitalization is over $14 billion dollars. There are numerous examples like this, but the point is clear. Speculators clearly have too much liquidity.
On a more macro scale, we are unlikely to see the overall froth in the equity markets settle down unless we have a crushing sell-off. People are creatures of habit, and they clearly have resorted to the same sort of speculative activity that led to the stock market meltdowns in 2000 and 2008. The chances are high that at some point we will get that crushing sell-off yet again.
Carvana’s financials are ugly, at best. I prefer the word hideous. Certainly not the numbers of a company that should be valued at $14 billion!!
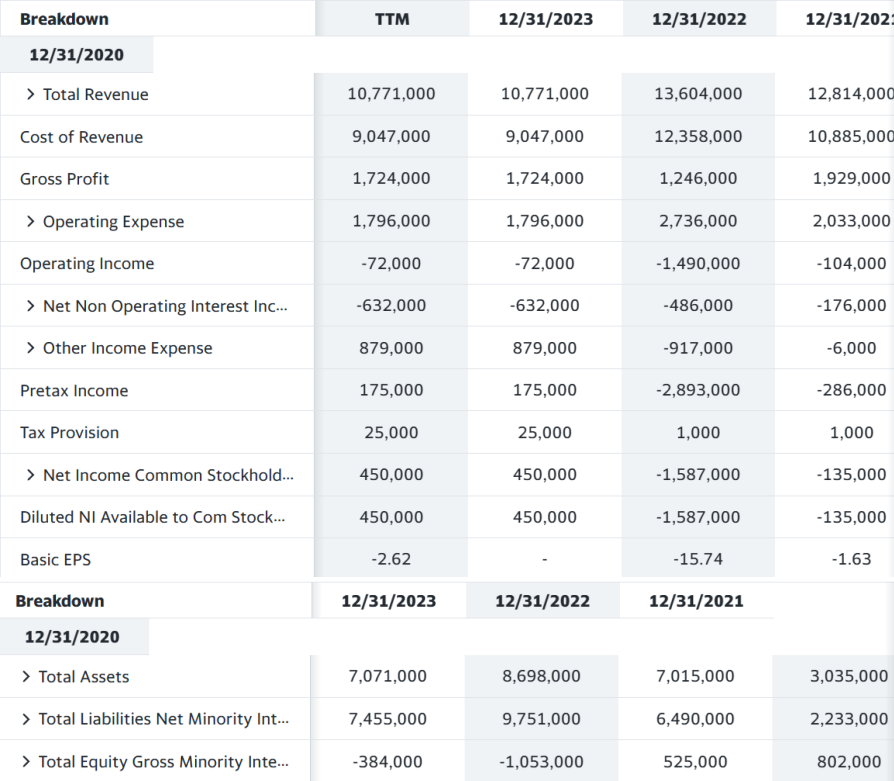
Is it a coincidence that the risk-free interest rate in 1999 and 2007 was essentially the same as it is today – 5.25%? Perhaps, but I am not so sure. The fact is that wild, speculative markets can continue to run amok with high risk-free interest rates, but that dynamic has typically ended in a market crash and much lower interest rates to follow.
There are a few things happening now that are particularly concerning. As I noted last week, in the big picture the current level of US debt is frightening, but the path is outright terrifying. Fresh debt of $1 trillion every hundred days is not sustainable, and at some point we are going to hit the tipping point at which investors refuse to buy more of our government paper without charging a very steep interest rate premium. This is a progressive process, but it could easily snowball unless our government starts to act somewhat responsibly. If this ugly scenario plays out badly, it could easily lead to a total economic collapse. It would hardly be the first time that a nation has collapsed under a mountain of debt.
We saw this happen with Attila the Hun, the Romans, and many others. We need to start reining in our profligate federal spending habits, and that will not be an easy fight. Clearly, Congress wants to keep spending, and special interest groups want to keep that gravy train rolling. At the same time, raising taxes to pay for the spending is a hugely unpopular proposition. In fact, fighting against tax increases and otherwise avoiding taxes is a favorite American pastime.
We are therefore left with the following alternatives: 1. We either raise taxes aggressively to pay for our spending (and choke off growth); or 2. We have a huge surge in our population to grow the work force and economy (immigration is a political hot button); or 3. We finally reduce our government spending; or 4. We have some combination of the three. None of these are easy solutions in the current environment.
What is astonishing is how poor many of our government services are given the vast spending that takes place, but that is a separate matter. Putting that aside, the fact is that the spending needs to get reined in. As referenced above, the only way to otherwise address the massive deficit is to have a huge growth in our population and enjoy the consequent growth in our GDP, have huge tax increases and experience much softer economic growth, or some combination of the above. A huge increase in our population would create massive demand for housing, services, automobiles, computers, phones, clothes, education, and pretty much everything else, but this is a politically hot topic that I don’t want to touch. I will only say that objectively, aside from the social ramifications, it would certainly bring economic benefits. In fact, much of our job growth over the past several years is a result of fresh immigration.
Regarding the recent job report, the data is misleading. Yes, on average we are seeing steady employment increases of 200,000+/- each month. That is great. The fact that a lot of this job growth can be attributed to recent surges in immigration is a fascinating sidebar to the US political environment. Another interesting sidebar to the US political environment is that America is essentially a nation of immigrants. Let’s put these things on the side, though, as immigration is too contentious a topic.
The misleading part of the job report has to do with the U6 unemployment data. This figure relates to the underemployed people who are working part time out of necessity. They are typically working several jobs at once to try to make ends meet, so although they are working, I would not describe them as happily employed. They are struggling, and this number is the segment of the employment data that points to underlying labor market problems.
We have limited fresh hiring in many cyclicals, including manufacturing, transportation, construction, and so on. The hiring in this sector hasn’t been this soft for over twelve years. Does this mean a recession is around the corner? No, although there are other factors that are more concerning.
In particular, the drop in M2 money supply that I mentioned in a previous write-up has become more extreme. The drop is now in excess of 4%. The last time we had a drop of this magnitude was right before the Great Depression, ninety-four years ago. The 1920’s, the “Roaring 20s,” was a decade of great economic growth, and great American excess.
The Dow increased by 600% over an eight-year period, starting in August of 1921. It was a time of tremendous technological advances, and the economy was fueled by widespread growth of innovations like radios, telephones, cars, and other things that led to increased economies of scale and increased profits for companies. More significantly, there was also enormous consumer spending and wild speculation in stocks. Moreover, the economy was healing from a pandemic – the Spanish flu – and the central bank was pouring money into the system to further fuel the growth.
Does this sound a little familiar? Consider the following. The Nasdaq has growth 11-fold over the past twelve years. Many of the other characteristics of today’s economy are shockingly similar. The standard explanation for the stock market crash and subsequent Great Depression has been the explanation provided by Keynesian economists who maintained that the government simply did too little rescue the economy. Yes, there was excessive, foolish speculation, but the boom/bust business cycle of the 1920s/1930s needs to be considered a bit more carefully considering the stark similarities to today.
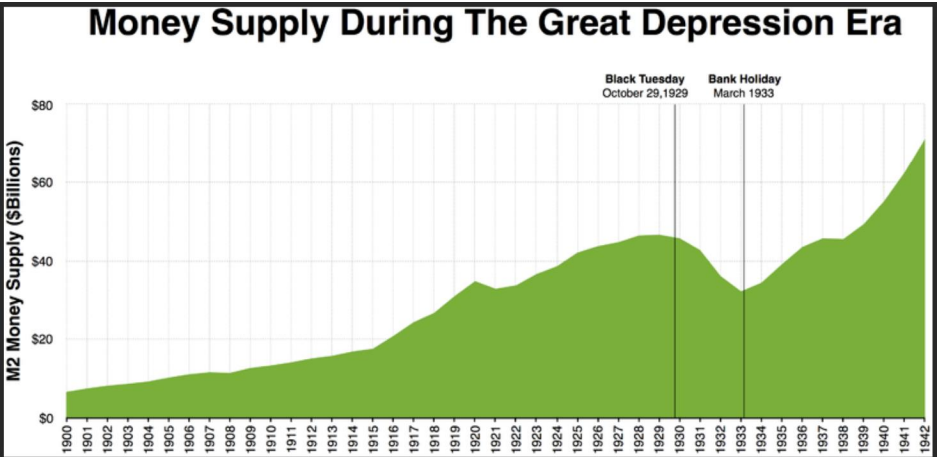
The chart below depicts quite well what happened to the M2 Money Supply during the Great Depression Era. M2 money supply jumped sharply in the years before the crash of 1929, and then dropped sharply over the following years.
The chart below shows how M2 money supply rose sharply prior to 2022, before dropping sharply over the past 13 months. This drop of nearly 5% is the largest decline since the Great Depression. This is coming after the Fed increased the M2 by roughly 25% in response to the pandemic in 2020.
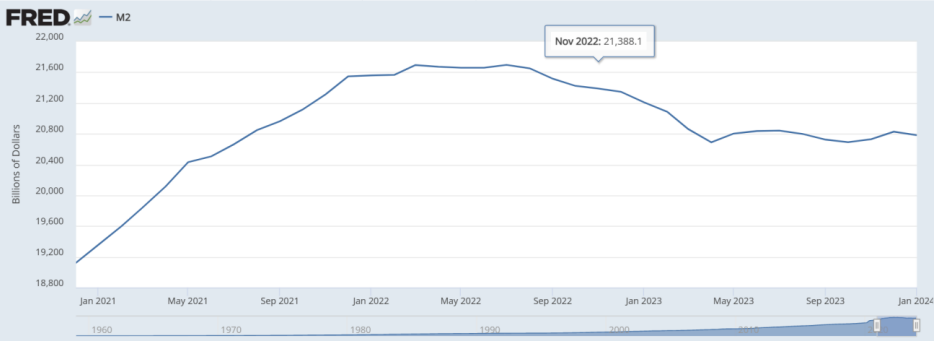
In recent years, the Fed engineered a massive boom with the largest money supply increase in percentage terms since World War II. Are we going to have the bust to follow? I am not formally forecasting that – yet – but I am increasingly concerned. The speculative fervor in the markets, the heavy concentration in the stock market, the massive holdings in stocks by a very small percentage of the population, the stickiness of the inflation data, the nearly insane levels of government spending when the economy is growing (reducing the government’s ability to address a possible future crisis), the heavily inverted yield curve (we had a similarly inverted yield curve prior to each of the past eight recessions) all point to an increasingly risky economic picture.
I understand that 75% of the entire US stock market capitalization is comprised by the largest 10% of the companies. This concentration is more extreme than we had during the Dot-com bubble in 2000. It is also comparable to the concentration of the 1929 stock market top. We really need to exercise some caution here.
As I have explained, I have started to layer in a diversified basket of bearish option structures on a variety of stocks. Yes, Nvidia is one of the stocks, but I only have a small allocation there right now. Overall, the portfolio is doing very well since Nvidia has been such an outlier and the other stocks are all behaving as expected; i.e. they are going down. META, Tesla, Apple, etc. are all behaving as expected. If I had simply bought a put on the broader index, I wouldn’t be making nearly as much money on the recent sell-offs in the Magnificent Seven.
Going forward, I will selectively increase the bet, but I am not in a rush. Instead, I am now shifting my focus more heavily back to my love – forex. I view the Japanese yen as the ultimate safe haven currency, and I have many reasons to believe that the shift into the yen has started. The price action is certainly encouraging, and the fundamentals should be highly supportive of this view.
Japan is very likely going to end its negative rate policy – finally – and start the interest rate normalization process. Thirty-year Japanese yields are back up towards 1.8%, which might not sound like much, but it is an enormous jump from where they were. In fact, the 30-year Japanese bond yield has been a fantastic indicator of future moves in dollar yen and the yen crosses.
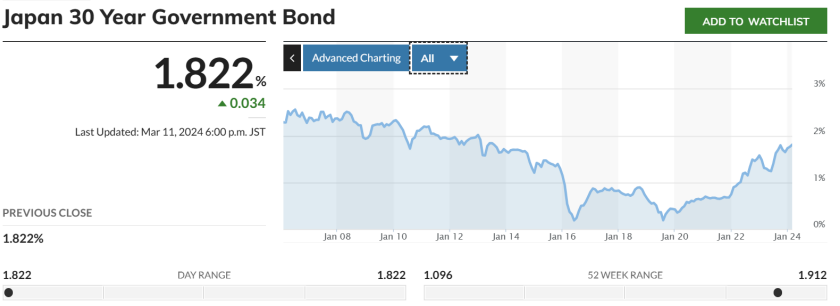
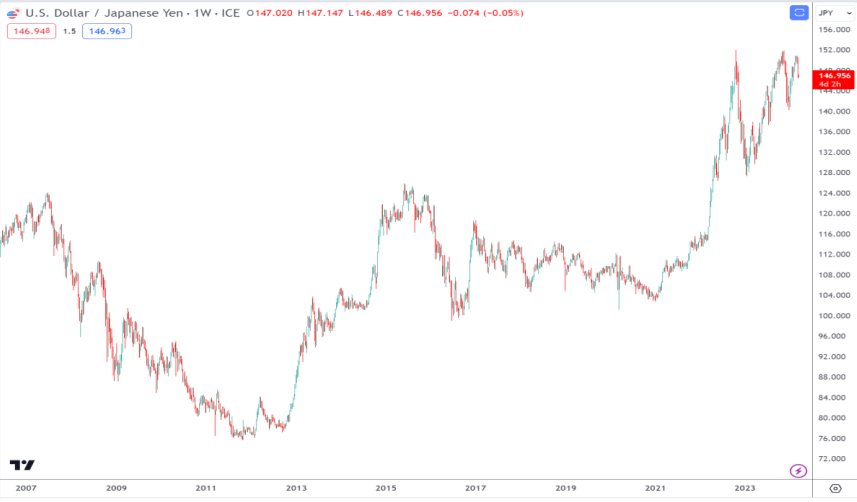
Essentially, major shifts in the bond yields tends to lead to large capital flows either out of Japan, or back in. Japanese investors hold over $2 trillion worth of foreign bonds, with well over $1 trillion of these bonds held in US Treasuries. As we inch closer to a 2% Japanese government bond yield, I am expecting some of the massive foreign Japanese holdings to be repatriated to Japan. In combination with US rates heading lower in a few months, the relative attractiveness of domestic Japanese yields will be very compelling.
How big a move am I expecting? That is the billion-dollar question, but at a minimum I am expecting a relatively quick and violent move down to 127.00. Once the dollar breaks below 140.00, we will have a sharp drop towards 137.20. Once that level is taken out, the next leg lower will be very aggressive.
The dollar will be under pressure overall at that time, so the yen crosses will work fine, but the dollar will be the best play in that scenario. Later, once the dollar finds support against the other major currencies, then the yen crosses will probably continue lower. In the big picture, a sharp sell-off in global equity markets could further fuel yen buying, so potentially, this is a move that can continue well below 120.00 yen per dollar. It is VERY early in the move, but this is the general direction that we will likely be heading. I prefer a basket of currencies against the yen, with a variety of cross plays against dollar, Swiss franc, euro, Canadian dollar, and British pound. It is often easier to carry the basket as the overall volatility should be lower. We will discuss this further in future write-ups.
Wishing you the best of luck in the markets.
Andy Krieger