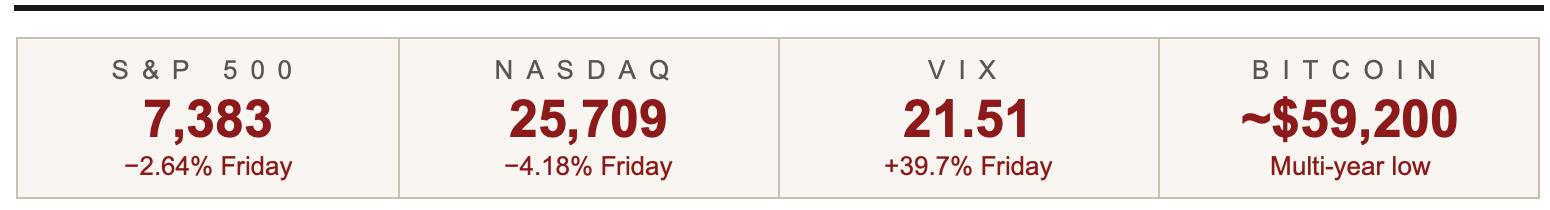
Bitcoin Is Sending Us A Very Loud Warning – Is Anyone Listening?
Thoughts on the Market: A Weekly Analysis of Markets, Risk. and the Road Ahead, by Andy Krieger
June 8, 2026
In my next write-up, I will address some interesting currency trades that are nearly ready. Today, I want to focus on the blowout jobs report that sent equities to their worst day in eight months, causing the VIX to explode by nearly 40%, and pushing Bitcoin to a new multi-year low. For those who have heeded my warnings about Bitcoin, it was a very lucrative week.
For months, this letter has maintained a consistent and unpopular thesis: that Bitcoin’s collapse from its October 2025 all-time high of $126,198 was not merely a short-term correction, but rather the start of a much larger downtrend to follow. I issued this first warning on November 17, 2025, and I have repeated the message multiple times. For years, Bitcoin has been the leading indicator for risk-on assets, so we need to pay close attention to its warning signals about those same assets when it enters a sharp decline.
The sharp sell-off in equities that we warned about in February, right before the colossal mess created by Operation Epic Fury, was a relatively easy move to forecast. Equities had stalled for nearly five months and without a fresh positive stimulus, it was obvious that the market needed a strong correction to shake out the weak long positions and position the market for its next surge higher. I had the added advantage of seeing the dismal performance of Bitcoin over the prior few months as a further warning that a downsizing in risk exposure was imminent.
After the sharp correction in equities in March, we were treated to a big technical bounce in Bitcoin, which confirmed perfectly that the stock market was indeed free to start climbing. Several weeks ago, however, Bitcoin ran out of juice and began its next downward assault on prior support levels. It completed a perfect corrective rally in the middle of May, stopping at key Fibonacci resistance levels; this led me to try to determine how long this divergence might last.
When a major market is in a blow-off stage, its rallies typically go parabolic right before the matching parabolic decline begins. The rally in stocks since the lows at the end of March have certainly been parabolic, but I am not convinced that the parabolic crash is quite ready. Frankly, I would prefer to see one more surge higher to suck everyone into the market who has been watching stocks’ powerful rally without participating. The power of FOMO can be overwhelming to all but the most disciplined investors.
Bitcoin looks almost certain to make another strong run at its lows from Friday, and a decisive close below $60,000 will open up a quick assault on $50,000. I would expect stocks to try to rally as Bitcoin stages a weak recovery now, but this bounce in Bitcoin is likely going to be relatively short-lived. Perhaps it will bounce back toward $68,000–$70,000, but I expect more liquidations to follow.
At the same time, stocks are setting up for a climactic blow-off top that will be followed by an historic decline. I repeat my urging that long-term investors should structure some long-term protective hedges that will enable them to sleep well at night and not worry about the fact that the stock market is essentially the most overvalued market we have ever had by nearly every measure. I hope that my readers have started scaling out of their long exposures as I have suggested several times. The combination of establishing long-term hedges and scaling out of positions on market strength allows the investor to lock in some large profits and further protect the portfolio from potentially sharp, adverse market moves.
Friday was a wild day for the equity markets. It was marked by a level of violence that we should all study closely. It was not a garden-variety sell-off on bad news, but rather was the more ominous signal of a dangerously overbought market that fails to rally on good news before the selling pressure leads to a violent decline throughout the day. This was exactly the warning that I wrote about two weeks ago when I wrote:

I. The Jobs Report: A Classic “Good News Is Bad News” Moment
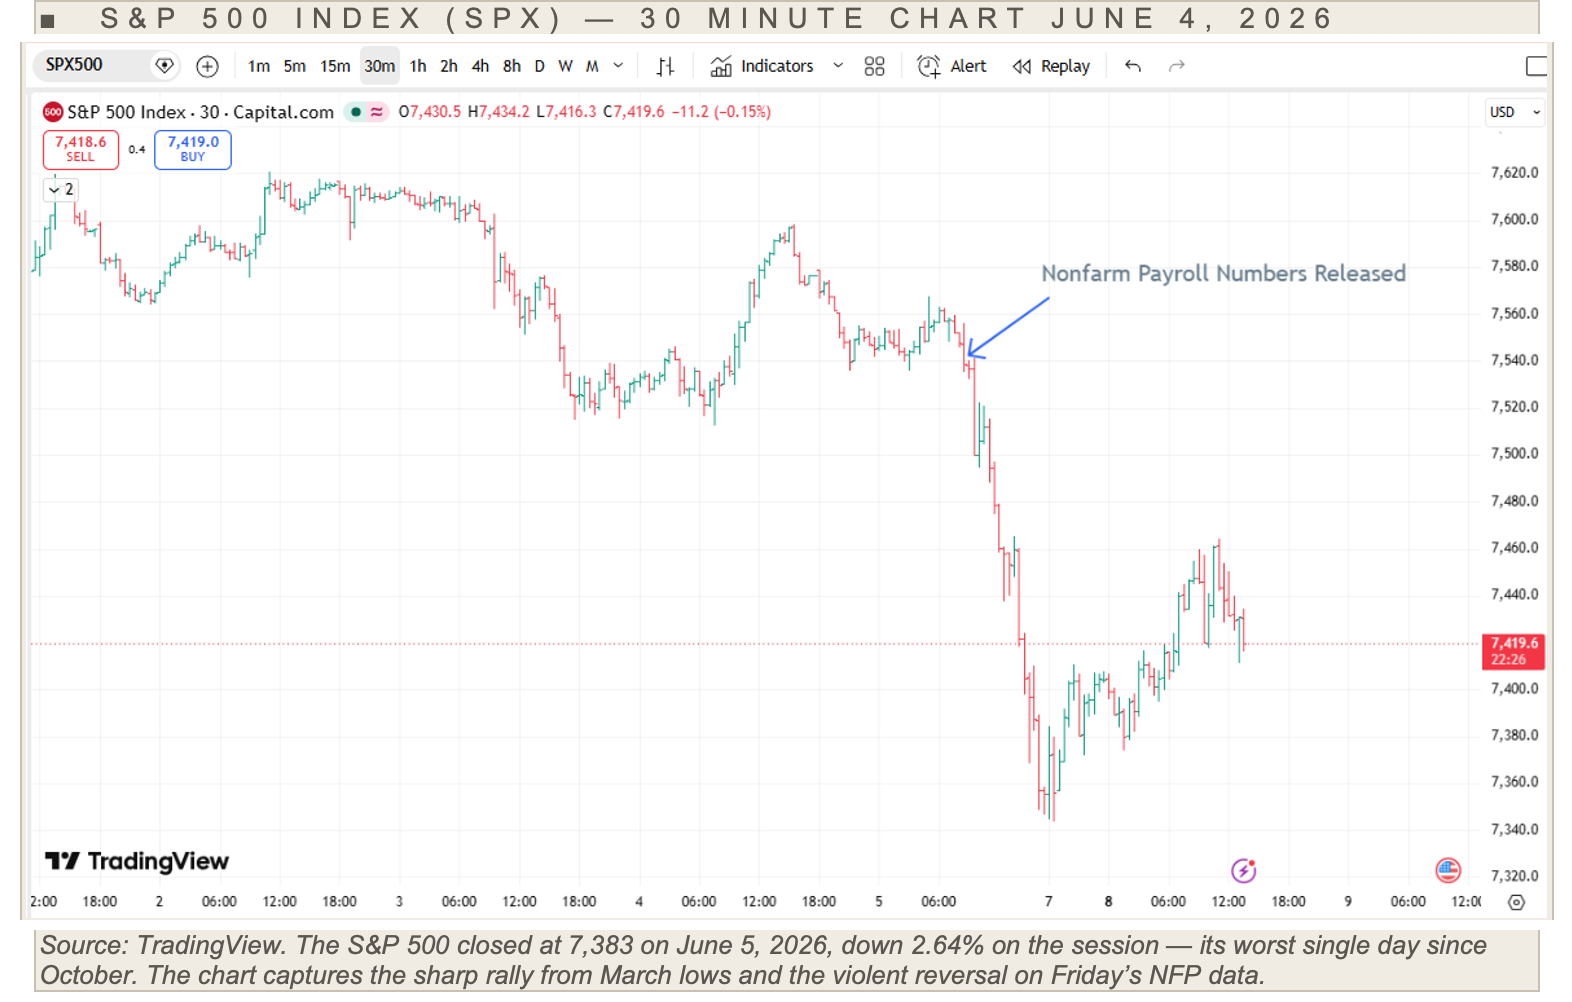
Two weeks ago, this letter advised readers to wait for exactly this moment: a market that failed to rally on positive data, and then to sell aggressively. The May employment report was the catalyst. For my readers who followed my trading advice, Friday should have been a very, very profitable day. We got very good news, which the market did not rally on, so all of the conditions were in place to play for a sharp move lower. By the close, the market had dropped by more than 2.6% from the early morning levels when the news came out, so hopefully you all had a wonderful day.
To recap, the U.S. economy added 172,000 jobs in May, more than double the consensus forecast of 85,000, with particularly strong gains in leisure and hospitality (70,000), local government (55,000), and health care (35,000). March payrolls were revised up by 29,000 to 214,000, and April was revised up by 64,000 to 179,000. This means the prior two months combined were 93,000 stronger than previously understood.
By any objective historical standard, this was a blowout report. The market’s response was to collapse. The S&P 500 fell 2.64%, its worst single session since October, while the Nasdaq posted a stunning 4.18% decline, its largest drop since the tariff turmoil of early 2025. The Dow fell 695 points, ending the S&P 500’s nine-consecutive-week winning streak.
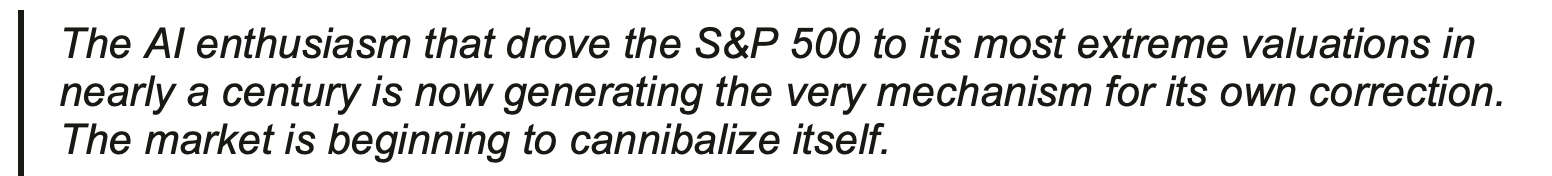
The mechanism is straightforward. A labor market this strong typically means persistent inflation. Persistent inflation means a Federal Reserve that cannot cut rates. In fact, the Fed may yet be forced to raise them. That is certainly what the market is starting to price in. Coupled with the devastating impact of higher oil prices, the inflation outlook for the U.S. looks dismal indeed. The 10-year Treasury yield surged to 4.54% on the payrolls beat, resetting the discount rate embedded in every equity multiple in the market. A market priced to perfection simply cannot absorb that math.
II. The Complacency Trap: What the VIX Was Telling Us
One of the most significant, and most overlooked, dimensions of Friday’s sell-off is what the options market was signaling in the hours before the carnage began.
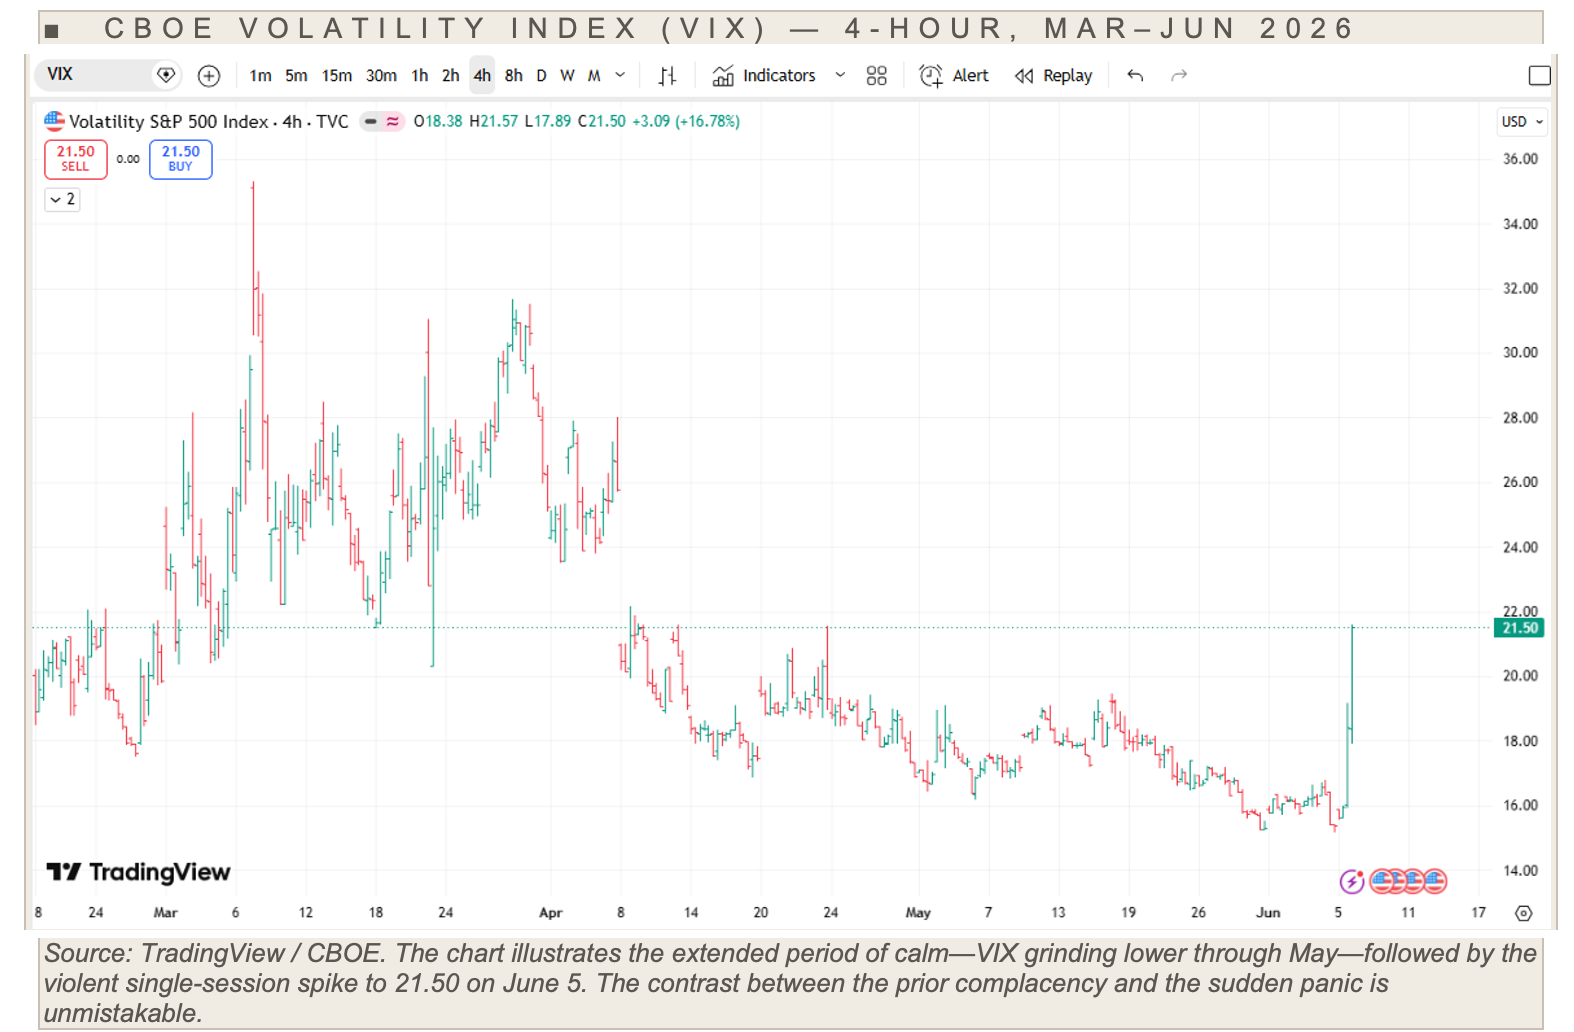
The VIX, the CBOE’s measure of implied volatility derived from S&P 500 options, closed Thursday at 15.40, with a Friday opening print of just 15.87. These are historically subdued readings. A VIX in the mid-teens represents the market’s collective judgment that near-term volatility will be modest, implying the absence of large-scale put buying, the downside hedges that serve as shock absorbers when conditions deteriorate.
When the market is braced for trouble, a shock can be absorbed. When it is sleeping, a shock finds no natural buyer on the other side. The result is an air pocket.
That is precisely what happened. The VIX exploded to close at 21.51, a surge of 6.11 points, or nearly 40%, in a single trading session. A 40% single-day move in the fear index from an already complacent starting point is the signature of genuine panic, not orderly repositioning. The intraday swing from 15.56 to 21.57 reflects the scramble of participants caught completely flat-footed, forced to buy protection after the fact at dramatically elevated prices. Options market makers, who were short volatility heading into Friday, were compelled to aggressively delta-hedge their books, amplifying the equity selling in a self-reinforcing loop.
The VIX’s 52-week range runs from 13.38 to 35.30—meaning the fear index, despite Friday’s eruption, remains well below the peaks of the March 2026 sell-off. There is considerably more room to move higher, but first I expect the U.S. administration to try to calm investors’ nerves by talking up the market and downplaying the risk of higher interest rates.
III. Bitcoin at a Multi-Year Low: The Canary Has Been Singing for Months
Readers of this letter will recall that I have maintained, with considerable persistence and against considerable skepticism, a bearish view on Bitcoin since its October 2025 all-time high near $126,200. I identified Bitcoin as the quintessential leading indicator of speculative risk appetite: the asset that turns first when liquidity begins to drain from the system. I warned explicitly of targets at $50,000 and potentially far lower.
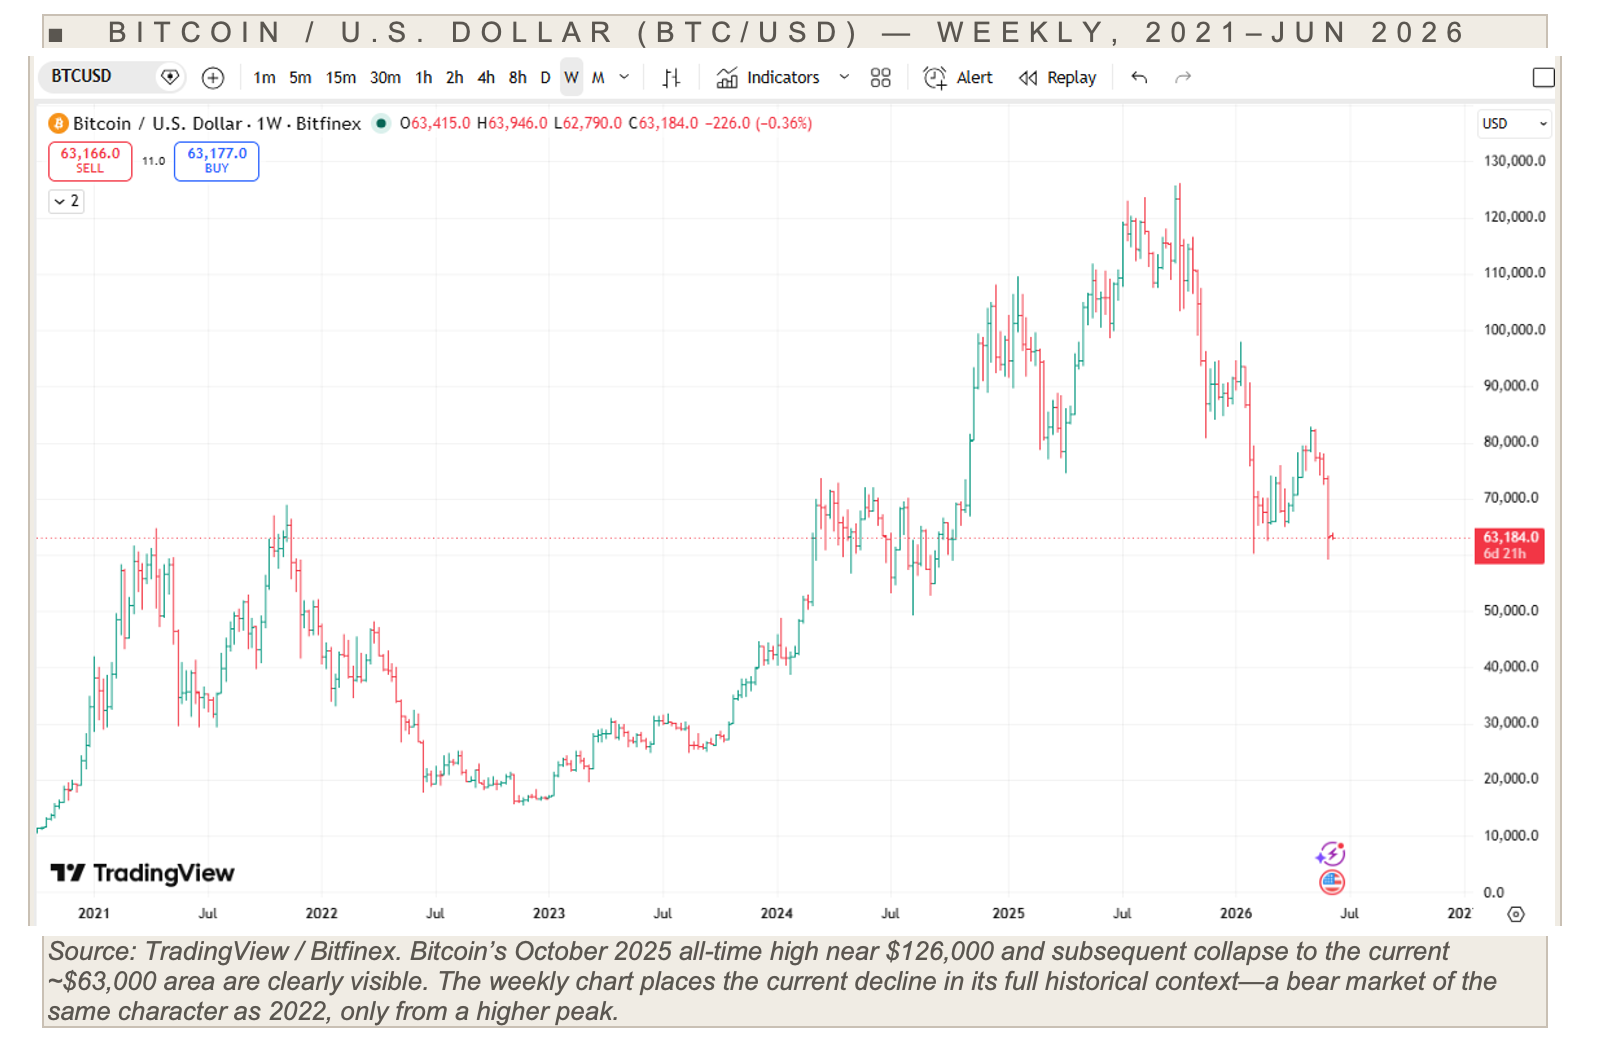
Bitcoin posted a new multi-year low of approximately $59,200 during Friday’s sell-off, a level not seen since the fall of 2024. From the all-time high near $126,200, the decline now exceeds 53%. For readers who acted on this letter’s guidance to position for downside in Bitcoin, the past several months have been exceptionally rewarding. This was not an easy trade to hold; it required conviction at moments when the market’s corrective bounces were sharp and convincing. That conviction has been vindicated.
The fundamental dynamics driving Bitcoin lower are precisely those described in these pages: 13 consecutive days of net outflows from U.S.-listed spot Bitcoin ETFs; rotation of speculative liquidity into AI and semiconductor names; geopolitical uncertainty compressing risk appetite globally. Bitcoin has also definitively failed the “digital gold” narrative. In the current Iran conflict, it sold off alongside other risk assets rather than rallying as a safe haven, confirming its nature as a speculative vehicle, not a store of value.
Key support near $50,000 is now being watched closely. I would not be surprised to see a test of that level. If it fails to hold on a closing basis, considerably lower prices remain on the table.

IV. The Great Capital Vacuum: Big Tech, SpaceX, and the Liquidity Drain
There is a second structural headwind acting on equity markets; one that has received almost no serious analytical attention in the mainstream financial press. It operates quietly but powerfully: the sheer magnitude of capital being simultaneously mobilized for mega-IPOs and Big Tech equity offerings, all competing for the same pool of institutional and retail investor dollars.
The equity offerings already underway
Alphabet completed an $84.75 billion equity offering this week. It was among the largest equity capital raises in recent corporate history, structured as a public offering, an at-the-market program, and a $10 billion private placement anchored by Berkshire Hathaway. Proceeds are earmarked entirely for AI data centers and global compute capacity.
The same day Friday’s equity markets collapsed, the Financial Times reported that Meta is considering selling tens of billions of dollars in new shares to fund its own AI infrastructure buildout, and that it was Alphabet’s successful offering that encouraged Meta’s executives to consider a similar move. Meta shares closed down 5.5% on the report alone. The company has already raised its 2026 capital expenditure guidance to $125–$145 billion, filed for a $30 billion bond offering, and struck a $27 billion financing deal with Blue Owl Capital. Still, the AI arms race demands more – much, much more!
The imminent IPO wave
SpaceX launched its roadshow on June 4, the very same day markets sold off violently, targeting $75 billion in proceeds at a $1.75 trillion valuation. This would constitute the largest IPO in stock market history. Pricing is set for June 11, with shares beginning to trade June 12 on Nasdaq under the ticker SPCX. Elon Musk is reportedly allocating up to 30% of shares to retail investors – roughly three times the typical allocation – ensuring the capital drain reaches far beyond institutional portfolios.
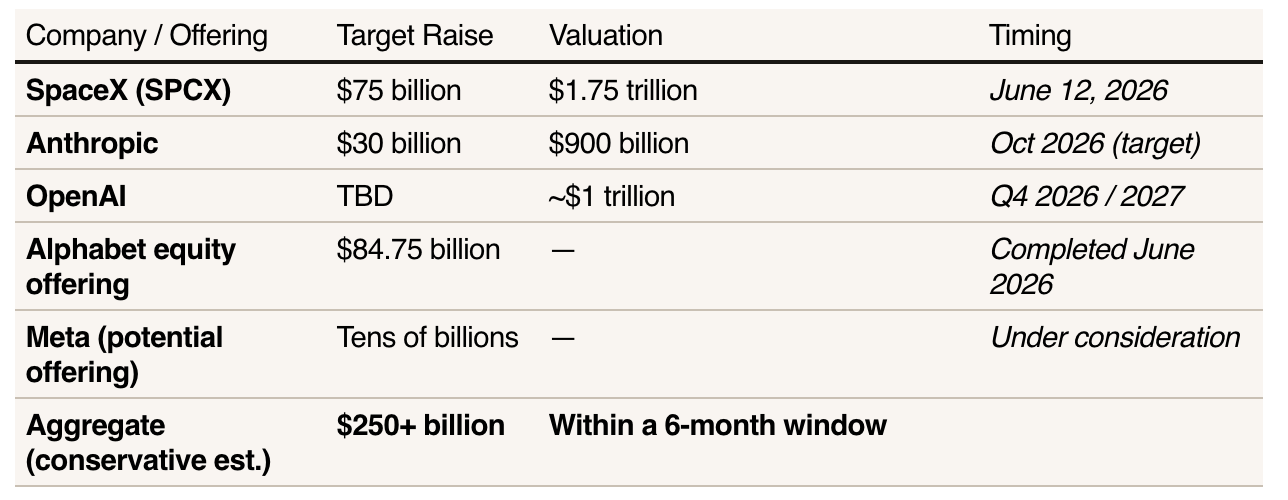
Goldman Sachs projects the four largest tech companies will spend a combined $5.3 trillion on AI capital expenditures by 2030. Every dollar that flows into a SpaceX IPO allocation, a new Alphabet share, or a Meta equity offering must come from somewhere. For institutional investors, that typically means selling existing equity holdings. For retail investors, it means liquidating brokerage positions. The result is a systematic, structural source of selling pressure on the broader market — invisible on any single day’s tape, but unmistakable in the aggregate.

V. Iran and the Geopolitical Wildcard: No Incentive to Deal
The continued Iranian strikes on Kuwait and Israel this past week confirm what this letter has stated plainly for months: Iran is in absolutely no hurry to negotiate a binding settlement with the United States. The strategic logic is unmistakable to anyone willing to read it clearly.
Iran fired missiles and drones at Bahrain and Kuwait this week, killing at least one person and causing significant damage to Kuwait International Airport, which was forced to suspend flights. These strikes came even as President Trump publicly suggested that a ceasefire “remains in place” and that negotiations have gone “very well.” The gap between that characterization and the reality on the ground is extraordinary.
The calculation from Tehran is rational, if ruthless: the longer they delay a binding settlement, the greater their leverage. President Trump’s job approval rating has fallen to a record low of 34% in the YouGov/Economist poll, the lowest level recorded across both of his terms in office, and lower than any approval rating President Biden received during his presidency. The net approval rating stands at negative 26 percentage points. The collapse among male voters -- a net rating of negative 21 points, down from positive 16 at the start of his term -- represents a 37-point swing in a demographic that was central to Trump’s 2024 victory.
Iran reads American politics. A president at record-low approval – with midterm elections approaching and rising energy prices fueling domestic discontent – is a weakened negotiating counterparty. Every week that passes without a deal is a week in which Iran preserves its leverage and watches its adversary’s domestic position erode further. President Trump can claim that he doesn’t care about the midterms or the near-term impact of the near 50% spike in oil prices, but he is clearly desperate to find a way out of the Iran mess he created.
The chaotic situation in the Middle East is further complicated by the pressure President Trump is now putting on Israel to end its campaign against Hezbollah in Lebanon. This very public interference in the foreign policy efforts of America’s staunch, long-term ally clearly smacks of desperation by the current U.S. administration to try to cut a deal with Iran.
The market implications, however, are direct. Each escalation reprices energy and fertilizer markets higher and adds another layer of inflationary pressure to an economy already running about 100% above the Fed’s 2% target. A direct naval confrontation in the Strait of Hormuz remains a tail risk that would immediately and dramatically amplify all of the dynamics described in this letter. There is no meaningful progress toward resolution on any near-term horizon.

VI. Priced to Perfection—and Beyond
The most reliable long-run gauge of equity valuation — the ratio of nonfinancial market capitalization to gross value-added (MarketCap/GVA) — is now at its highest reading since 1928. Today’s conditions are no less extreme than at the 1929 and 2000 bubble peaks. What makes the current moment historically significant is that this extreme appears across every major valuation framework developed over the past century, using entirely different methodologies and data sources.
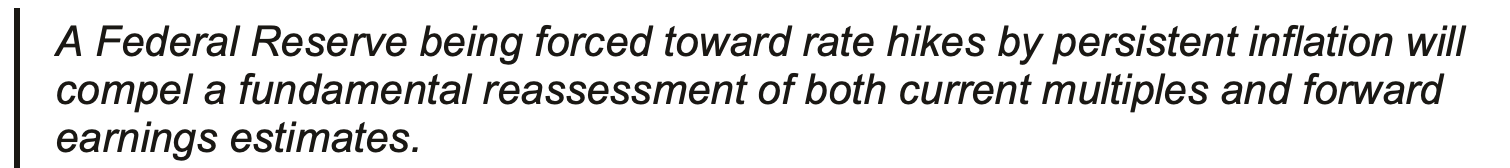
The rate picture has turned sharply against the bull case. A 40% probability of a Fed rate hike at the December 2026 FOMC meeting is now priced into futures. This is sharply higher than a mere 3% expectation at the June meeting. The 10-year yield’s move to 4.54% on Friday is not a rounding error. It is a repricing of the risk-free rate that must, with mathematical certainty, compress every equity multiple built on the assumption of cheap capital in perpetuity.
VII. What to Expect From Here
Friday’s action may not mark the beginning of the full secular bear market this letter has been anticipating. It is, however, in my judgment, the beginning of a meaningful correction that should retrace a significant portion of the rally from the March 30, 2026 lows … and potentially the catalyst that sets the broader decline in motion.
The structural forces I have outlined are not transitory. They are durable, measurable, and accelerating: Extreme valuations meeting a Fed forced toward tightening. The largest simultaneous capital mobilization in market history competing for finite investor dollars. An Iranian conflict with no immediate resolution in sight, adding inflation pressure and geopolitical risk premium. A president at record-low approval with diminishing room to maneuver. In fact, if the president decides to launch renewed attacks on Iran, he will face a far more emboldened Congress than he had to deal with just a few months back.
My guidance remains unchanged. Use rallies to reduce equity exposure. Maintain and, where possible, expand downside hedges. Do not be lulled by corrective bounces. Lots of investors will follow Pavlovian-type instincts and simply buy dips because that is what may have worked in the past. This letter has warned repeatedly that the pattern involves violent relief rallies within a broader deteriorating structure.
The other factor that you need to bear in mind is the potential aggregate selling force that could come from the aggressive unwinding of long equity futures positions held by the leveraged CTA community. Do not underestimate the magnitude of their total positions, or the potential negative cascading effect when their sell stops get triggered. We got close to hitting several major triggers on Friday, so a further sharp downside move will likely trigger a large unwind that will overwhelm short-term buyers.
For those who heeded the guidance on Bitcoin, on short-term trading strategies in equities, and on equity hedges: the trades may have felt a bit uncomfortable, but they have been vindicated and rewarding. There is, in my judgment, considerably more to come.
I want to wish you all the best of luck with your trading. We should have many excellent opportunities to profit from over the coming weeks and months.
Andy Krieger
Disclaimer: This publication is provided for informational and analytical purposes only and does not constitute investment advice, a solicitation, or a recommendation to buy or sell any security. Past performance does not guarantee future results. All data cited is sourced from publicly available reports including BLS, CBOE, Yahoo Finance, Reuters, the Financial Times, TradingView, and CoinDesk, among others. Readers should conduct their own due diligence and consult a qualified financial adviser before making investment decisions. © 2026 The Warning Signal. All rights reserved.
From Imre Gams:
My Framework:
I treat markets as auctions, not prediction machines.
Most sessions on a day-to-day basis are balanced.
Edges form at the extremes of value.
I trade acceptance and rejection at those edges.
If value migrates, I align with it.
If it fails, I trade the rotation.
I am not in the business of forecasting.
I am in the business of validating participation.
_________________________________________________________
The week started with selling pressure contained by the minor support zone. Buyers responded and drove the market straight into the first upside target of 7629 to 7639. That level marked the high for the week.
What followed on Friday was decisive. Sellers took over and drove price through the major support zone and straight through the downside target zone of 7423 to 7458.
That changes the picture.
The 7423 to 7458 zone is now the control zone heading into this week. Above it, buyers need to reclaim 7518 to 7549 first. Do that and the upside targets come back into view — 7629 to 7639, then 7655 to 7676.
Below the control zone, the next downside targets come in at 7278 to 7300, followed by 7184 to 7209.
The burden of proof has shifted back to the bulls.
Last week's control zone capped buyers at every turn. When they finally gave up, the break was swift — price hit the 4411 downside target for the second time in recent weeks.
This time it didn't hold.
For the first time in weeks, gold closed below 4411. That's a meaningful shift. A level that twice proved itself as a genuine floor has now been broken. The market is telling you something different.
4411 becomes the control level heading into this week. The old control zone of 4536 to 4586 is now the first upside target. Above there, 4722 to 4785 remains the next objective.
Below 4411, two downside targets come into focus — 4259 first, then 4107.
The bulls have lost a level they defended twice. Now they need to reclaim it.
Buyers showed up at the $86 to $88 support zone and held their ground. Price pushed straight up to the first objective — the $94 to $97 control zone.
That's where sellers took over. They pushed back but couldn't reach the support zone before the week closed.
The result is a market caught between two well-defined levels with neither side able to land a decisive blow. The parameters haven't changed.
Hold $86 to $88 and the $94 to $97 control zone remains the first upside target. Reclaim that and the ladder opens up — $102.52, then $104.85 to $107.30, then $110 to $112.
Lose $86 to $88 and $80 comes back into play.
Same levels. Same scenarios. The market hasn't given us a new answer yet.