Cruising Towards Calamity?

Thoughts on the Market
October 16, 2025
Because it plays a massive role both domestically and in the portfolios of investors all around the world, this write-up will do a deep dive into the U.S. stock market. As of 2025, approximately 162 million U.S. adults -- more than half the population -- have some exposure to the stock market. This massive number of domestic participants includes:
Types of Stock Market Exposure
- Direct investments: Individual ownership of stocks or mutual funds through brokerage accounts.
- Retirement accounts: Participation in 401(k)s, IRAs, and other pension plans that invest in equities.
- Indirect exposure: Through employer-sponsored plans, annuities, or financial products tied to market performance.
Although the distribution of ownership in the U.S. is remarkably unbalanced – with the wealthiest 10% of Americans owning a supermajority of all stocks owned by Americans – that doesn’t minimize the critical global role of the U.S. stock market.
The U.S. stock market holds outsized influence globally for multiple interlocking economic, structural, and psychological reasons. As of October 15, 2025, the total market capitalization of all U.S. equities, including all publicly traded companies across NYSE, NASDAQ, and OTC markets. reached approximately $70.3 trillion.
Why the U.S. Stock Market Matters Globally
Foreign ownership now accounts for nearly 18% of the total U.S. equity market, a sharp rise from historical norms.
Based on the most recent Treasury and Federal Reserve data, foreign investors hold approximately $17 trillion in U.S. stocks. This figure reflects continued global confidence in U.S. corporate earnings, dollar stability, and market liquidity, even amid rising geopolitical and monetary uncertainty. Capital is concentrated in large-cap tech, financials, and consumer sectors, with heavy exposure to index-linked vehicles.
1. Sheer Size and Liquidity
- The U.S. market represents more than one-half of total global equity market capitalization.
- U.S. exchanges like NYSE and NASDAQ are the most liquid in the world, attracting institutional investors seeking efficient price discovery and execution.
2. Dollar Dominance
- Most global trade and finance is denominated in U.S. dollars, making dollar-based assets -- especially equities -- a cornerstone of global portfolios.
- Because of dollar dominance, U.S. monetary policy (e.g., Fed rate decisions) directly impacts global capital flows.
3. Innovation and Corporate Leadership
- U.S. firms dominate sectors like tech, biotech, and consumer platforms. Think Apple, Microsoft, Nvidia -- these are not just American companies; they’re global economic engines.
- The U.S. fosters a culture of entrepreneurship and innovation, which reinforces its market leadership.
4. Benchmarking and Index Weighting
- Global indexes like MSCI, ACWI, and FTSE All-World are heavily weighted toward U.S. equities.
- This means passive investment vehicles worldwide are structurally tied to U.S. market performance.
5. Safe Haven Status
- In times of global uncertainty, investors often flee to U.S. assets, especially Treasuries and blue-chip stocks.
- The U.S. market acts as a shock absorber for global volatility, even when domestic fundamentals are mixed.
6. News Flow and Sentiment Transmission
- Economic data from the U.S. (jobs, inflation, earnings) often triggers synchronized movements in global markets, while foreign data rarely moves U.S. indices.
- This asymmetry reflects the U.S.'s role as the sentiment setter for global risk appetite.
- The U.S. remains the primary equity destination for sovereign wealth funds, pension systems, and global asset managers seeking liquidity and legal protections.
More Facts and Figures:
- In 1960, foreign ownership in U.S. equities was just 2%; by 2000, it reached 7%, and it now stands at 18%.
- Europe accounts for nearly half of all foreign holdings in U.S. equities.
- Foreign purchases are often driven by their trade surpluses with the U.S.; exporters receive dollars and recycle them into U.S. assets like equities.
- Despite recent rising tension in foreign relations due to tariffs, foreign investors remain net buyers of U.S. stocks, viewing them as liquid, transparent, and resilient.
The chart (below) of the S&P500 since 2008 is a succinct, graphic representation of the astonishing run in U.S. stocks over the past sixteen years. But are the current market levels sustainable, or are we simply in another massive bubble that is nearly ready to burst?
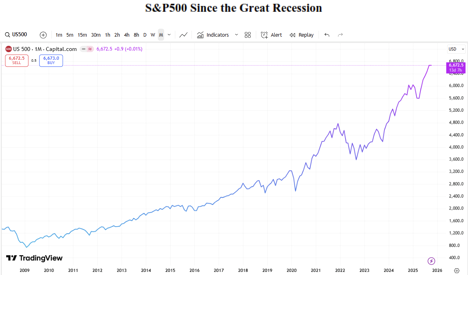
At first glance, the performance has been remarkable. The market has grown more than ten-fold in sixteen years. Without looking into this matter deeply, one might logically assume that the underlying fundamentals must be fantastic. But are they? We are going to explore this matter from a few different perspectives. The conclusions should be quite interesting.
First, let’s have a look at a Bloomberg chart showing the yield of U.S. stocks on an inflation-adjusted basis.
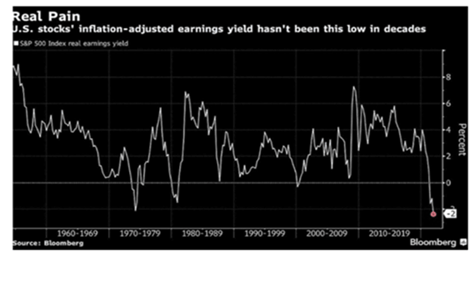
The Bloomberg chart (above) shows that that the inflation-adjusted earnings yield on U.S. stocks is at its lowest level in decades. If you know how to interpret this, it can be a powerful signal about market valuation, investor expectations, and macroeconomic dynamics.
First of all, what is inflation-adjusted earnings yield?
Earnings yield is the inverse of the price-to-earnings (P/E) ratio:

When adjusted for inflation, it reflects the real return investors can expect from corporate earnings, net of purchasing power erosion.
Why Is a Low Real Earnings Yield Significant?
A historically low inflation-adjusted earnings yield, such as we have now, suggests:
- Stocks are expensive relative to their real earnings: In other words, investors are paying more for each dollar of inflation-adjusted earnings.
- Future returns may be lower: Historically, low earnings yields have been associated with subdued long-term equity returns.
- Risk premiums are compressed: Investors are accepting lower compensation for equity risk, possibly due to optimism or lack of alternatives.
Historical Context
According to recent data:
- The inflation-adjusted earnings yield on the S&P 500 is hovering at or below multi-decade lows.
- Real earnings have grown, but not as fast as stock prices, especially post-pandemic.
- The S&P 500 index itself is essentially at all-time highs in nominal terms, but its real valuation metrics are stretched to a dangerous degree.
- This suggests the U.S. stock market is extremely overvalued relative to GDP.
How About Other Measures Such as the Buffett Indicator?
The Buffett Indicator is a valuation metric that compares the total market capitalization of a country’s public stock market to its gross domestic product (GDP). It’s often expressed as a percentage:

Named for the Oracle of Omaha, this indicator was popularized by Warren Buffett, who once called it “probably the best single measure of where valuations stand at any given moment.”
Why Is It Important?
The indicator provides a broad snapshot of market valuation relative to the size of the economy. Here's why it's useful:
- Macro-level insight: It captures the relationship between the stock market and the real economy.
- Overvaluation signal: A high ratio suggests that stocks are expensive relative to economic output.
- Undervaluation signal: A low ratio may indicate that stocks are cheap and potentially poised for growth.
Historical Forecasting Value
Historically, the Buffett Indicator has been a reliable long-term warning signal:
- Dot-com bubble (2000): The indicator soared to what was then a very high level -- above 150% -- and a major crash followed.
- 2008 financial crisis: It was elevated before the crash, though not as extreme.
- COVID-19 rebound (2020–2021): The indicator hit record highs of 208%, prompting concerns about frothy valuations. A sharp correction ensued.
Unfortunately, the Buffett Indicator is not a precise timing tool -- markets can remain overvalued for years before correcting – but instead, serves more as a thermometer than a stopwatch. In other words, the Buffett Indicator warns us about sharply increased risks, but it doesn’t give any guidance regarding the timing of a possible sharp correction. That said, the correction after each of these “warnings” was significant. The most modest correction of the three referenced examples was the 27.5% correction that followed the COVID-19 rebound.
Currently, the indicator is way above the prior all-time high level. In fact, it recently reached 221%. As Buffett says, “when the indicator approaches 200%, investors are playing with fire.” At current levels, he considers the market to be dangerously overvalued, suggesting a high likelihood for lower long-term returns and increased volatility
What It Says About a Potential Sell-Off
- Extreme overvaluation: The market is priced at more than double the size of the U.S. economy.
- Elevated risk: Historically, such levels have preceded major corrections or bear markets.
- Caveats:
- Low interest rates and high corporate profits can justify higher valuations.
- Globalization and tech sector dominance may distort the traditional GDP-to-market cap relationship.
Still, the current reading implies that future returns may be lower, and the probability of a significant market correction is elevated, though the exact timing remains uncertain. The chart below summarizes the historical levels of the indicator.
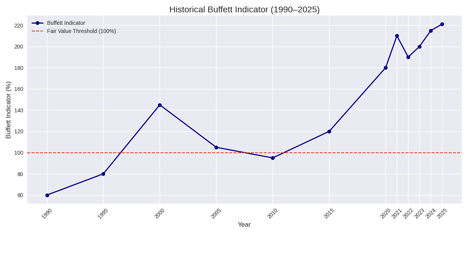
Historical Buffett Indicator (1990–2025)
- As previously noted, the indicator has surged from around 60% in 1990 to recent levels of 221% this month, far above its historical average.
- The red dashed line at 100% marks the traditional fair value threshold.
- This dramatic rise highlights how disconnected market valuations have become from economic output.
Looking at other indicators such as the Shiller P/E (CAPE) metric – Price/Average 10-year Inflation-adjusted Earnings – we again identify a market with valuations that are highly elevated. While the Buffett Indicator is the most macro-oriented, reflecting the entire market’s valuation relative to the economy, when I look at many other indicators, I find the same thing: our stock market is grossly overvalued right now, potentially dangerously so.
What Major Valuation Metrics Suggest
All major valuation metrics are way above historical norms, pointing to a market that’s at risk of a significant downturn. While this doesn’t guarantee a crash, it does imply:
- Lower expected returns over the next 5–10 years.
- Higher risk of correction, especially if economic growth slows, inflation rises, or interest rates rise.
- Caution for investors, especially those entering at these levels.
Key Drivers Behind the Decline
1. High Valuations
- The S&P 500’s P/E ratio remains elevated, driven by enthusiasm for tech and AI stocks.
- Investors are pricing in strong future growth, which may or may not materialize.
2. Sticky Inflation
- Even as headline inflation moderates, core inflation remains persistent.
- This erodes real earnings and compresses real yields.
3. Interest Rate Environment
- Higher interest rates typically pressure equity valuations, but…
- Equities have remained resilient, suggesting a disconnect between bond and equity markets.
4. Corporate Profit Margins
- Margins have been strong but may face pressure from wage growth, input costs, and global competition.
Are we in a bubble that is getting ready to burst, or is this time really different?
Looked at in isolation, my conclusion is that equities are extremely overpriced right now. And when I look at equities in the context of the overall macroeconomic scenario, I see something much worse. In fact, I see flashing red warning lights telling me that we are approaching an economic crisis. One of the reasons for this is that since the Great Recession, markets have been propped up by unprecedented monetary and fiscal intervention.
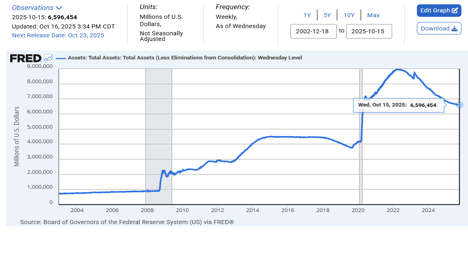
Consider the following chart:
Federal Reserve Balance Sheet Explosion – the Fed’s balance sheet has ballooned from under $1 trillion in 2008 to nearly $9 trillion at its peak in 2022, before modest tightening began. Knowing that this dramatic injection of funds has been leveraged by commercial lenders, the growth in the Fed’s balance sheet has been far more meaningful than the raw numbers might suggest.
Massive Federal Deficit Spending
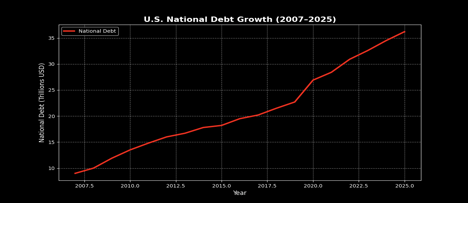
- During this same time period, the U.S. national debt has surged from $10 trillion in 2008 to $38 trillion and counting.
- Trillions in stimulus spending during COVID and post-pandemic infrastructure bills artificially and dramatically boosted GDP and corporate earnings, masking underlying economic fragility.
Together, these policies decoupled asset prices from fundamentals, creating a market that’s addicted to stimulus. We are looking at thirty-five trillion dollars of excess stimulation from the U.S. authorities since the 2008. Let’s ponder this number: $35,000,000,000,000.00 of artificial stimulus, pumped by Washington into the system over the past 17 years. This is not just dangerous, it is potentially catastrophic.
I've extensively discussed how policymakers have repeatedly deferred economic reckoning by injecting increasingly large sums of artificial liquidity into the system. These interventions have reached extraordinary levels, aimed at concealing underlying economic fragility and staving off recessions—not out of concern for stability, but to preserve political power. Recognizing that the electorate tends to vote based on their financial well-being, officials have gone to great lengths to sustain the illusion of perpetual prosperity, funneling trillions into the economy to prop up markets and sentiment.
This strategy has enabled the political elite to maintain control over federal spending for years, bolstered by pressure from special interest groups that benefit from keeping the fiscal taps wide open. While such tactics are not new, what sets the current moment apart is the sheer scale of accumulated interventions. The economy may be able to shoulder current debt levels for another few years, but if the trajectory of borrowing continues unchecked, a debt crisis of historic magnitude is inevitable unless decisive action is taken, and soon.
As for the notion that tariff revenues will meaningfully reduce our ballooning federal deficit—don’t buy into it. While tariffs may generate a few hundred billion dollars, they ultimately function as a tax on American consumers. When the government is running a $2 trillion annual deficit, these revenues barely make a dent. Moreover, the economic uncertainty and geopolitical strain caused by aggressive tariff policies are already manifesting in a weakening labor market. This downturn is no accident—it's a direct consequence of policies that prioritize optics over sustainable growth.
The chart below of the growth of U.S. National Debt makes it clear that our debt levels have rocketed higher; the servicing of this debt is going to create more and more risk for our nation going forward.
Let's Pivot Back to the Stock Market
By the end of 2008, the total market capitalization of U.S. stocks was approximately $11.2 trillion. (This marked a significant decline from the previous year due to the global financial crisis, which caused widespread losses across equity markets.) For context, the U.S. stock market had peaked at around $19.5 trillion in 2007, before the downturn began.
As of mid-October 2025, the total market capitalization of the U.S. stock market reached approximately $70.3 trillion. (This figure reflects the combined value of all publicly traded U.S. companies across major exchanges like the NYSE, Nasdaq, and OTC markets.) To understand the signifigance of this number, it is important to examine how much growth has been the result of the dramatic government and Federal Reserve stimulus?
We’re rapidly approaching a tipping point where a severe stock market sell-off seems all but certain. Because no U.S. president wants to be remembered for presiding over a market collapse, the Federal Reserve will likely respond by cutting interest rates, and the government will roll out emergency spending and stimulus packages. But this time, investors may interpret those actions not as reassurance, but as panic, fueling even more aggressive selling.
And the trouble doesn’t stop at the federal level. A host of other systemic risks are gathering on the horizon, each with the potential to compound the fallout. Here are just a few:
-Corporate Debt and Fragile Balance Sheets: Corporate debt is at record highs, much of it issued at ultra-low rates. As refinancing becomes more expensive, profit margins are squeezed, and defaults may rise – especially in speculative-grade credit.
-Narrow Market Leadership: A handful of mega-cap tech stocks (e.g., Apple, Microsoft, Nvidia) have driven most of the market’s gains. This lack of breadth is historically a warning sign -- when leadership falters, the broader market often follows.
-Global Economic and Geopolitical Headwinds: Slowing global growth, especially in China and Europe, threatens multinational earnings. Geopolitical tensions (e.g., Taiwan, Ukraine, Middle East) add uncertainty and risk premium. This can lead to supply chain fragility and deglobalization trends, both of which could raise costs and reduce margins.
-Behavioral Euphoria and Retail Speculation: Retail investors have poured into speculative assets, meme stocks, and options trading. This echoes late-stage bull market behavior, where sentiment detaches from fundamentals.
A Market Priced for Perfection
The market today is:
- Historically overvalued
- Heavily reliant on past stimulus
- Exposed to macro and geopolitical shocks
While a crash isn’t guaranteed, the risk-reward balance is skewed. If earnings disappoint, if inflation resurges (or even creeps higher), or if policy missteps occur, the correction will be swift and severe.
What are the Key Risk Factors For a Major Decline?
- Labor Market Weakness: Rising unemployment claims and slowing hiring could signal economic cooling.
- Inflation & Tariffs: Mounting price pressures and rising tariffs are pushing market-based inflation forecasts higher.
- Tech Sector Fragility: Mixed results from mega-cap tech firms like Microsoft, Tesla, and Meta have exposed cracks in the AI-driven rally.
- Interest Rate Uncertainty: Persistent inflation complicates the Federal Reserve’s path, increasing volatility.
How Far Could the Market Decline?
- Bearish Forecasts: Some analysts predict a potential drop of up to 58% in major indices if historical downturn patterns repeat. In a worst-case scenario, I wouldn’t be shocked to see a total market decline of 77%.
- Time Horizon: Such a decline could unfold over 12 to 24 months, especially if multiple risk factors converge -- like a recession, earnings collapse, and geopolitical shocks.
Stagflation or Worse
- Inflation: Stays elevated (3% -- 4%) despite weak growth.
- Fed Policy: Stuck between sticky inflation and recession risks.
- Market Impact: Valuations fall sharply (Buffett Indicator to ~140%), equities drop 30–40%.
- Debt & Balance Sheet: Deficits widen; Fed may pause QT or resume QE.
Recession & Credit Shock
- Inflation: Drops fast due to demand collapse.
- Fed Policy: Slashes rates, resumes QE.
- Market Impact: Buffett Indicator reverts to ~100%, equities plunge 50–60%.
- Debt & Balance Sheet: Explosive deficit growth; Fed balance sheet expands again.
I don’t mean to sound alarming, but the warning signs are there. The fundamentals are lining up in a progressively ugly direction, and the overvaluations are becoming more and more stretched. Even so, there are some steps you can take to reduce your exposure:
- Diversification: Consider assets with better inflation protection (e.g., TIPS, commodities).
- Valuation discipline: Focus on sectors or stocks with reasonable real earnings yield.
- Global exposure: Some international markets may offer more attractive real yields.
- Risk management: Be cautious with leverage and speculative positions.
Other Risks: The Housing Market
The housing market is largely frozen, with affordability gridlock
- Mortgage rates remain elevated, hovering around 6.55%, which is historically high compared to the ultra-low rates of 2020–2021.
- Home prices haven’t corrected enough to offset the rate shock, leaving many buyers sidelined and sellers reluctant to list.
Inventory Bottleneck
- Existing homeowners are “locked in” by low-rate mortgages and unwilling to sell, creating a supply drought.
- New construction is constrained by labor shortages and regulatory drag, though builders are cautiously optimistic3.
- Actual buyer traffic and transaction volume remain near 30-year lows, making this a sentiment-led stall rather than a true recovery.
Housing Market Outlook
Analysts expect the market to remain sluggish until mid-2026, when rate cuts and labor market stabilization may unlock pent-up demand.
Key Risks to Regional Bank Balance Sheets
There are also growing risks with regional bank balance sheets. Regional bank balance sheets are under renewed scrutiny in late 2025, and for good reason. The risks are layered – some visible, others lurking beneath the surface. Here's a structured breakdown tailored to your analytical lens:
1. Commercial Real Estate (CRE) Exposure
- Many regional banks are heavily concentrated in CRE loans, especially office and retail properties.
- Recent revaluations show that reported delinquencies understate true risk by up to 4x, due to undercollateralized loans and slow mark-to-market adjustments.
- Geographic clustering amplifies vulnerability to localized shocks.
2. Loan Quality Deterioration
- A surge in non-depository financial institution (NDFI) loans -- often riskier and less transparent -- has raised red flags.
- Recent bankruptcies (e.g., First Brands, Tricolor Holdings) exposed fraud and weak oversight, triggering broader credit concerns4.
3. Interest Rate Pressure
Elevated rates have squeezed net interest margins, especially for banks with long-duration assets funded by short-term liabilities. I don’t pretend to know what the ultimate trigger will be for a massive correction in stock market valuations. What I do know is that corrections are a natural part of any market sequence. I touched on the magnitude of other major market corrections (i.e. roughly 77%), in my last write-up and I have since identified a number of similar examples. Do I think that over a thirty to thirty-six-month period we could see a major sell-off of that magnitude in equities? I wouldn’t bet against it. In fact, I would assign a much higher probability to an event like this than at any time since 2009. Am I spending a lot of money on limited-risk plays to benefit from a potentially vicious decline? The answer is …sort of. We have structured a large play to benefit from a violent move lower, but we have found mechanisms to do this safely without spending a lot of money. Plus we have a lot of time for this idea to potentially work out. We don’t need this to happen to generate nice returns, but it would be a fabulous boost to the returns in case a steep correction does develop.
Conclusion
There are a variety of related things that I want to address – including a deeper dive into how the housing market plays into this scenario – but they will wait until my next write-up. I apologize for the length of this week’s newsletter, but I wanted the warning I am giving about current market conditions to be thorough. Note that I am not suggesting that a dramatic decline is necessarily imminent. I am, however, providing evidence that the probability of one occurring increases more and more as valuations diverge further and further from safe, sustainable levels. In a future newsletter I will address some of the growing demographic risks our country faces as well as some of the eerily frightening similarities we are currently witnessing to patterns from the 1920’s.
I will also have another look at gold and the yen, as well as Bitcoin, which has been a persistent leading indicator for other risk assets for quite a while. They are all behaving in very interesting ways.
In the meanwhile, I want to wish you all the best of luck with your trading.
Andy Krieger