Crypto-Credit Contagion
Thoughts on the Market
December 1, 2025
Last week I wrote extensively about Bitcoin, forecasting a corrective bounce before the resumption of its powerful decline. Let’s have a look at how this forecast has played out:
Brief Synopsis of The Technical Picture
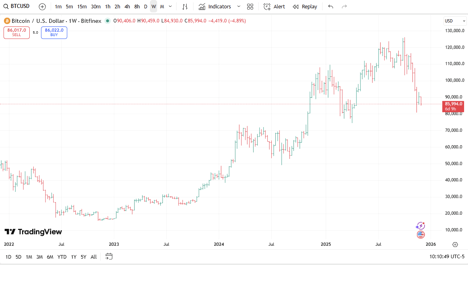
- Recent Bounce: The rebound to $93,116 last Friday was textbook corrective action, retracing about 44% of the decline before resuming downward momentum. (My students will understand why this level was particularly significant.)
- Current Levels: The crash to $84,000 this morning highlights the force of the underlying bear market.
- Key Support: The $80,822 low from November 21 is the immediate line in the sand. If broken, the next critical level will be the April low of $74,500.
- Longer Term Target: My call for $50,000 aligns with a broader technical breakdown scenario if those supports fail.
- If things really get ugly, we could eventually break through the $50,000 level and test levels below $30,000, but we should take things one step at a time.
Macro & Market Implications
- Risk Gauge: Bitcoin has to some extent become a proxy for investor sentiment. Its sharp declines often coincide with broader “risk-off” moves in equities and high-yield credit.
- Contagion Risk: With Bitcoin-linked ETFs, futures, and leveraged products now mainstream, forced liquidations will eventually spill into other asset classes.
- Liquidity Stress: Now that banks and brokers accommodate crypto speculation, it means that margin calls in Bitcoin can trigger sales of stocks, bonds, or commodities.
Broader Context
- Market Value: At $1.7 trillion, Bitcoin is larger than many national stock markets, so its moves are no longer isolated.
- Daily Turnover: With tens of billions of dollars in daily turnover, liquidity shocks in Bitcoin can ripple across global markets.
- Psychological Levels: The April low at $74,500 is not just technical – it’s psychological. Breaking it would accelerate panic selling.
What to Watch Next
- Short-Term: Whether Bitcoin consolidates above $80,822 or slices through that level without a strong bounce will set the tone for December.
- Medium-Term: A decisive break below $74,500 will almost certainly trigger algorithmic selling and feed a powerful move towards my $50,000 target.
Bitcoin’s decline is more than a crypto story – it’s increasingly a barometer of global risk appetite. If the April lows give way, the move toward $50,000 could be swift, with contagion risks spilling into broader financial markets. Moreover, my eventual long-term target is much lower than $50,000, so please exercise patience before establishing fresh longs. We will be able to periodically play for significant corrective bounces, but for the most part, I will be primarily playing Bitcoin from the short side.
Even though my long-term outlook on equities remains bearish, I’ve consistently acknowledged the possibility of a rally to marginal new highs before the inevitable bursting of the market bubble. Investors are heavily leveraged and overwhelmingly bullish, seizing on any hint of positive news as justification to add more risk to their portfolios. Meanwhile, with consumer confidence collapsing and unemployment edging higher, the Fed has dangled a holiday gift by strongly suggesting another rate cut this month. That signal alone was enough to drive stocks higher into month-end, as investors willfully ignored the reality: the Fed is easing while inflation still runs more than 50% above target and liquidity remains historically abundant. This reveals the Fed’s true priorities, which appear far less about disciplined price stability and far more about supporting asset values at any cost. The question you need to bear in mind is how long can we trust the Fed to bail out any stock market weakness? I believe that when the bubble finally bursts, no amount of Fed or government intervention will be able to stem the decline. Positions are now too big for the authorities to really offset widespread market panic.
Let’s Consider the Reality – Inflation vs. Fed Policy
- Target: The Fed’s official inflation target is 2%.
- Current Inflation: Running above 3%, which is more than 50% above target. That’s what makes a rate cut so telling.
- Sticky Components: Services, housing, and wages are keeping inflation elevated, even as goods prices have cooled.
Why Policy Still Isn’t Restrictive
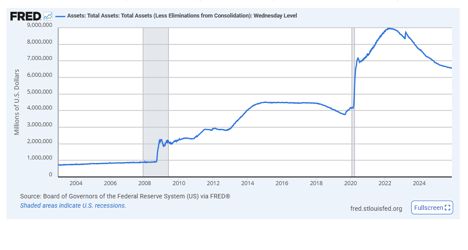
- Balance Sheet: The Fed’s assets remain $2.5 trillion larger than pre-COVID, meaning quantitative easing has not been unwound, and their balance sheet is roughly $6 trillion larger than before their quantitative easing during the Great Financial Crisis.
- Real Rates: Even with prior rate hikes, real interest rates (adjusted for inflation) are only marginally positive
- Fiscal Policy: Federal borrowing and spending are already at stratospheric levels, with much more to follow. (The U.S. Government deficit has increased from $10 Trillion to more than $38 Trillion in the past 16 years!!) This more than offsets the Fed’s tightening in recent years.
- In fact, the Federal Government is now increasing our federal deficit by nearly 7% a year – except during financial crises, when they borrow and spend even more.
Timing Issues
- Too Late After COVID: The Fed kept rates near zero well into 2021, despite surging inflation.
- Slow Normalization: Balance sheet reduction (“quantitative tightening”) has been modest compared to the massive stimulus injected.
- A December cut would signal the Fed prioritizes stock market strength while trying to downplay their dismal failure to get control over inflation.
- The fact that Trump complains about Jerome Powell running an interest rate policy that is too restrictive is nearly comical.
Implications
- Markets: Equities and risk assets rally on rate-cut expectations, but this simply further inflates the huge bubble that will eventually burst in dramatic fashion.
- This risks reigniting still more inflationary pressures which have largely stabilized at levels that are uncomfortably high.
- Credibility: Cutting rates while inflation is well above target will eventually undermine confidence in the Fed’s commitment to price stability, which will in turn lead to accelerated panic when the bubble finally bursts.
- Long-Term Risk: Persistently loose policy will entrench higher inflation expectations, forcing harsher action later – either by the Fed or by the markets.
Overall, the Fed’s stance is far from restrictive; balance sheet liquidity and fiscal stimulus remain massive. A December rate cut, with inflation still 50%+ above target and the promise of more massive government spending to follow in 2026, underscores how much the Fed is leaning toward supporting markets rather than fully normalizing policy.
The Tale of Two Economies: Cracks Beneath the Surface
Consumer confidence is unraveling. The Conference Board’s index plunged to 88.7 in November, its weakest since April, with the Expectations Index at 63.2 -- well below the recession‑warning threshold of 80. Inflation remains sticky, job growth is slowing, and nearly one in four households report living paycheck to paycheck. Yet markets continue to rally on the Fed’s promise of rate cuts, ignoring the disconnect between deteriorating fundamentals and policy signals.
Key Insights
- K‑Shaped Divide: Wealthier households are spending freely, while lower‑income families cut back on non‑essentials.
- Holiday Spending: Record sales mask fragility -- promotions stretch into January, and prices are 8%-10% higher than last year.
- Persistent Inflation: Electronics, apparel, and household goods all show elevated baseline prices.
- Generational Shifts: Gen Z leans on social media for shopping cues, millennials increasingly use AI tools to hunt deals.
PMI Signals: Manufacturing Weakness vs. Pockets of Resilience
The latest PMI data adds another layer to the divide:
- ISM Manufacturing PMI (Nov 2025): 48.2, signaling contraction for the ninth straight month. New orders and employment are weakening, inventories are falling, and prices remain elevated.
- S&P Global Manufacturing PMI (Nov 2025): 51.9, still modestly expansionary, though growth slowed to its weakest pace in four months. Smaller firms show resilience, but momentum is fading.
What does this mean? Larger manufacturers are struggling under tighter conditions, while smaller firms show pockets of strength. The divergence underscores the uneven state of the economy heading into year‑end.
Private Credit: The Hidden Fault Line
While consumer sentiment weakens and manufacturing shows strain, the private credit market looms as the most dangerous systemic risk. Once a niche sector, it has ballooned nearly tenfold since 2008 to $1.5 trillion AUM, with banks now holding $300 billion in exposure. This market played only a minor role in the Great Financial Crisis compared to the collapse of securitized mortgage products and the banking system’s exposure to them – but the risks from private credit today are severe.
Vulnerabilities
- Liquidity Risk: No deep secondary market -- exits are difficult if defaults rise.
- Credit Quality: Loans increasingly extended to highly leveraged middle‑market firms.
- Concentration: A handful of asset managers dominate, magnifying systemic risk.
- Bank Linkages: Stress could spill directly into regulated finance.
- Macro Pressure: Higher rates and slowing growth raise default probabilities.
The Federal Reserve Bank of Boston has warned that private credit’s growth could destabilize the system. Analysts call this a “systemic inflection point” –the sector’s first real stress test.
Bottom Line
The stock market bubble is obvious, with multiples at extraordinarily overvalued levels, but the fragility of private credit is a real systemic threat. Coupled with the potential contagion risk of a further crash in Bitcoin, the likelihood of the bursting of the stock market’s bubble is far greater than at any time in recent years. Consumer confidence is collapsing, PMI data shows manufacturing weakness, inflation remains sticky, housing is largely unaffordable, and private credit markets are dangerously exposed. If defaults rise, contagion could ripple across the financial system with far greater force than in 2008.
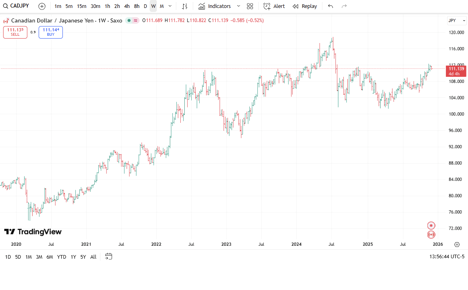
Regarding currencies, I have recently started increasing my exposure to a long Yen trade. Although I felt that Dollar/Yen close to the 158 level was a great short, I decided to focus my bet on Canada/Yen instead. The cross has rallied all the way back to 112.29 from the recent lows of 101.26. Even if this is going to be a long-term bull market -- which I seriously doubt -- there are plenty of technical reasons to think that it is now time to play for a move that should reach a short-term target between 107.70 and 105.20, with possible further declines over time. The risk-reward of the trade is compelling, as I am risking about 1% (I will exit the trade on a clear break above the recent highs) to earn at least 3%, but more likely 5%.
The compression of interest rates between Japan and Canada has not been priced in at all, and speculators who have plowed into the carry play to borrow in Yen and lend in Canadian Dollars have very little margin to play for now. Will this down move play out quickly? It is possible. Could it turn out to be a much bigger idea? Yes. Over time we could certainly have a sharp decline to re-test the 101.26 level, but I want to see how things develop before deciding whether to play for the bigger move or just the next decline towards 105.20. Frankly, earning 4% or 5% on this trade should be enough for now.
In the meanwhile, I want to wish you all the best of luck as you navigate the markets. December could prove to be a wild month.
Andy Krieger