Do We Need a Crystal Ball to Make Money Trading?

Thoughts on the Market
November 2, 2025
This week I am starting with a retrospective in order to explain better some of the logic and analysis that goes into my work. Over time, I plan to introduce some simple, specific trading strategies that we use on a regular basis. They are not particularly exciting, but if used properly, they can generate a steady stream of returns which can then be further turbo-charged using other sorts of trading strategies. I will still address some of the major macro themes that drive our more directional plays, but I also want to share some of the other sorts of trading ideas that you might find helpful.
My professional journey began with the ambition to become a professor of Sanskrit and Indian philosophy. I was deeply passionate about research, and thanks to generous grants, my entire education was fully funded. I envisioned a life much like my advisor’s -- teaching, writing, and immersing myself in ancient texts. Though I had dabbled in professional tennis, the constant travel wore me down, and academia felt like the right path.
That dream, however, unraveled abruptly. After completing my PhD coursework and translating an obscure 8th-century Sanskrit treatise on karma and rebirth, I began preparing my thesis. That’s when my advisor sat me down and delivered a sobering truth: I was a strong candidate, but the only way I’d secure a professorship was if someone in the field passed away. I thought he was joking. He wasn’t.
Panic set in. I had one child and another on the way, and I couldn’t afford to gamble on such slim odds. So I pivoted—dramatically -- into an MBA program in finance at the Wharton School. I knew nothing about business and had little interest in it, but I figured banking might be tolerable and financially stable.
From day one, I felt out of place. My classmates had years of experience at top consulting and banking firms. I had none. When summer recruiting began, my lack of a resume—and relevant experience -- was glaring. The only things I could list were academic achievements and fluency in seven languages. I had taken a course in option theory and found the research surprisingly engaging, so I decided to focus on foreign exchange options. I naively assumed my language skills could be spun as preparation for international finance. It was a stretch, but oddly enough, it worked. My unconventional resume drew attention, and I landed several interviews -- though no offers.
In a moment of desperation, I shaved my beard. It was a staple of the scholarly look, but clearly a liability on Wall Street. The following week, I received multiple offers. That experience cemented my cynicism: if facial hair could determine employability, success in finance must hinge on more than competence.
Despite my skepticism, I enjoyed my summer as a trader. When my mentor fell ill, I was thrust into executing large trades with virtually no experience. The pace was exhilarating, and I found the chaos oddly entertaining. I didn’t know what I was doing, but I wasn’t bored -- and that mattered.
After a semester off to trade options in Chicago, I returned to Wharton and completed my MBA. Working on the floor of the Chicago Board Options Exchange felt like competitive sports -- fast, intense, and mathematical. It suited me.
I had developed an options pricing model at Wharton, which led to a role trading currency options at Salomon Brothers, a premier firm at the time. I understood options and developed a strong intuition for forex markets. The hours were brutal --15 to 18 hours a day, five and a half days a week -- but I was fascinated by how traders managed their positions. They relied heavily on charts and historical data. I didn’t. I had a sign on my desk that read, “Every Sunken Ship Had a Chart Room.” My spot market decisions were based on instinct, while my options trading was rooted in volatility analysis.
During those early years, especially while running the currency options desk at Bankers Trust, I began refining theories about market behavior -- ideas that still guide me today. I concluded that markets are driven by irrational emotions, with fear and greed fueling erratic decisions. I learned to use options to capitalize on major shifts: reversals, accelerations, quiet periods, and volatility spikes.
Later, while working as a successor to George Soros, I shared these theories with him and demonstrated how to structure option plays ahead of anticipated major moves. He applied similar strategies when betting on the pound’s collapse. These methods generated hundreds of millions in profits -- without relying on technical signals.
The purpose of this essay is to offer insight into the thinking behind some of our primary trading strategies. While I enjoy capturing trends, I’m more interested in the magnitude of market moves than their direction. I care about the nature of the move -- whether it’s a steady trend or a volatile burst—and its likely duration.
This is what I call multi-dimensional analysis. I’m not just predicting short-term direction; I’m evaluating size, timing, and structure. The more dimensions I understand, the better the trade. For example, knowing with a high probability that market XYZ will likely remain in a 15% band over a set period is actionable. Simply knowing it might go up or down isn’t.
My approach differs sharply from typical short-term trading. While I might glance at momentum indicators or moving averages, they play little role in my structural option strategies. Those are probability-driven, built on years of data analysis, and largely indifferent to daily fluctuations.
Over my career, I’ve explored nearly every trading style -- medium-term trend following, short-term mean reversion, directional trading, and long-term macro strategies. They all work, but none match the consistency of structural option spreads grounded in probability.
Curiosity drove me to test each method, investing real capital to understand their mechanics. I could write a technical paper on each, but the key takeaway is this: to generate steady profits, you need an edge. Whether it’s superior information flow or bulletproof risk management, that edge is what separates success from mediocrity.
As you can likely guess, I am in a reassessment mode right now. Over the past twelve months we have had large moves in many markets – commodities, equities, currencies, and cryptocurrencies. You might find it interesting to have a look at a very simple measure – the deviation from current market levels to the 200-week moving average. Historically, the magnitude of that gap serves as a fantastic early warning signal when a market has become too frothy and over-extended in either direction.
Equities are a bit different because of the built-in bias of investors to be long the market. Therefore, the market very rarely dips below the 200-week average for more than a brief period of time.
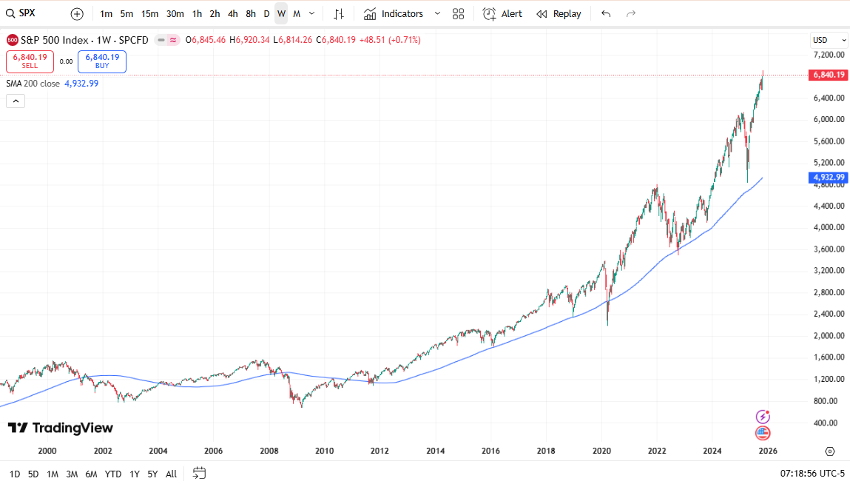
The brief period during Covid was one of the rare times when the market dipped below the 200-week average, and the period during the Great Financial Crisis was particularly unusual. It took the extreme situation of a near total collapse in the financial system for the market to trade below that average for an extended period of time. In fact, at its low point in 2009, the S&P500 was only slightly more than half the level of the 200-week average.
The current gap of 39%, however, is the largest I have identified during a bull market run.
Why This Gap Is Historically Significant
- The 200-week moving average is a long-term trend indicator, smoothing out nearly four years of price data. It’s used to assess whether markets are overextended or undervalued.
- A 39% gap is far above typical ranges. Historically, the S&P 500 has rarely traded more than 20–25% above its 200-week average for sustained periods.
- Similar gaps occurred during:
- The dot-com bubble (1999–2000) before the crash
- The post-COVID rally (2020–2021) driven by stimulus and tech exuberance
But the current gap is astounding by all historical measures.
There is no doubt that current valuations are extremely elevated. While the market may be discounting a plethora of positive news – expected strong earnings, low interest rates, and AI-driven optimism – the potential for mean reversion is about the highest on record.
Does this mean that a crash is imminent. Not necessarily, but at a minimum we can anticipate a period of consolidation with some corrective market action. If it turns out that the current rally has been driven more by sentiment and liquidity than by underlying earnings strength, then I would suggest that you better look out below.
At a minimum, for risk management purposes, we need to exercise caution in the current environment. If sentiment changes and fundamentals don’t justify the rosy forecasts, then the downside risk is huge. This is where the multi-dimensional analysis of a market is critical. I want to know beforehand how far the market might reasonably be expected to go if market conditions really sour, and I want to understand long a possible violent downturn might last.
Even during the most vicious market corrections, the sell-offs come in stages. Historically, for example, we have never dropped more than 50% during a two-month period. A move of even 40% during any two-month sell-off is exceedingly rare, having occurred only several times in the past one hundred years. Could we have some sort of catastrophic event – geopolitical, environmental, an even more lethal pandemic -- that triggers a move even greater than the 1929 crash, the dot.com crash, or the crash that occurred during the Great Financial Crisis? Yes, but the probability of that occurring is about .00004%. I am quite happy to take bets on this sort of event not occurring very often, but I still layer in protection against that one, exceedingly rare outlier possibly happening.
This is precisely the sort of analysis that goes into my options trading. I can structure ways to make money safely whether the market is rallying or selling off, and I can build in some plays to capture huge returns in case the market has one of its low probability sharp downturns. I have never liked selling options naked, as I always want to have some extra upside in case big moves occur, and naked short option plays don’t provide the potential extra upside returns. Yes, if they are well executed, they will make money most of the time, but I prefer to use spreading strategies that both generate premium to earn some money while also giving us the chance to earn the extra returns if unusual things happen in the markets.
I will returns to this over the coming weeks, but for now, let’s just focus on the reality that the risks of either an extended period of consolidation or a sharp sell-off – or some combination of both – is extremely heightened right now.
My assessment about the market risk is certainly confirmed by one of the greatest investors of all time – Warren Buffett. I have written about the astonishingly extended levels of his famous Buffett Indicator, but let’s have a look at his actual trading activity. Buffett has been a steady stock seller over the past five quarters, and he is currently sitting on a massive pile of cash – roughly $382 Billion.
Warren Buffett’s steady stock selling over the past five quarters signals caution about market valuations and potential economic headwinds. It reflects a strategic pivot toward cash preservation and defensive positioning.
Here’s what investors and market watchers can glean from Buffett’s moves:
- This sustained selling streak is highly unusual for Buffett, who typically favors long-term holdings.
- Cash Hoarding Signals Caution: Buffett’s preference for cash suggests he sees limited opportunities in the current market and may be bracing for a downturn or waiting for better valuations.
- Halting Buybacks: Berkshire has also paused its stock buyback program over the past four quarters, a stark contrast to the $20 billion buybacks seen in 2020–2021. This could indicate Buffett believes even Berkshire’s own stock is not undervalued enough to repurchase.
- Anticipating Economic Turbulence: Analysts like Paul Dietrich of Wedbush Securities interpret Buffett’s moves as preparation for a potential bear market or recession. Historically, Buffett has reduced exposure when macroeconomic indicators turn negative.
Stocks Buffett Has Sold Recently
- Buffett has exited or trimmed positions in major companies including Apple, Bank of America, Oracle, and Paramount Global. These are not fringe holdings, but core positions, which makes the selling even more noteworthy.
- The sales span sectors from tech to finance to media, suggesting a broad-based skepticism rather than sector-specific concerns.
Lessons to Glean from Buffett’s Actions
- Buffett’s actions often precede market shifts: While not infallible, his moves are grounded in deep analysis and long-term thinking. His retreat from equities may be a warning to reassess risk exposure.
- Cash is a strategic asset: In uncertain times, liquidity provides flexibility. Buffett’s cash pile positions him to act decisively when markets correct.
- Valuation discipline matters: Buffett’s selling implies that many stocks may be overpriced relative to their fundamentals, even after recent market rallies.
Why Buffett’s Information Edge Is Real — But Not Absolute
- Unmatched Access to Management: Buffett has direct lines to CEOs of major companies, giving him qualitative insights most investors can’t access.
- Decades of Pattern Recognition: With over 70 years of investing experience, Buffett has a deep understanding of market cycles, business models, and human behavior that few can rival.
- Massive Data Flow: Berkshire Hathaway owns dozens of businesses outright, giving Buffett real-time economic data across sectors like insurance, railroads, energy, and consumer goods — a unique macroeconomic dashboard.
- Long-Term Orientation: Buffett’s edge isn’t just information — it’s how he uses it. He’s famously patient, disciplined, and immune to short-term noise, which gives him a behavioral advantage.
But He’s Not Omniscient
- Others Have Different Edges:
- Quant funds like Renaissance Technologies or Citadel use high-frequency trading and alternative data sources (satellite imagery, credit card data) that Buffett doesn’t.
- Venture capitalists often see early-stage innovation before it hits public markets.
- Activist investors may have more influence over company strategy than Buffett typically exerts.
- He’s Said It Himself: Buffett has often emphasized that his success comes from temperament, not secret information. He believes most investors can do well by staying rational, avoiding fees, and thinking long term.
Bottom Line
Buffett’s informational advantage is significant, but it’s not about having better data, it’s about having better judgment and a longer time horizon. That’s something many investors can emulate, even if they can’t replicate his scale or access.
Buffett, Dalio, and Druckenmiller are all signaling caution -- but in different ways. Buffett is hoarding cash, Dalio is warning of bubbles and geopolitical risk, and Druckenmiller is rotating aggressively into AI plays like Microsoft.
Here’s a breakdown of how their recent moves compare:
Warren Buffett: Defensive and Patient
- Massive Stock Sales: Buffett has sold hundreds of billions worth of stocks over the past 11 quarters, including 70% of his Apple stake.
- Cash Pile: Berkshire Hathaway now holds $382 billion in cash -- a record amount.
- New Buys: He’s cautiously added UnitedHealth Group, a healthcare giant with long-term upside despite regulatory headwinds.
- Outlook: Buffett is preparing for volatility and sees few attractive valuations. His strategy is about preservation and optionality.
Ray Dalio: Macro Alarm Bells
- Bubble Warning: Dalio believes a bubble is forming in AI megacap stocks, but it may not pop until the Fed tightens policy.
- Geopolitical Risk: He’s warned of a potential “civil war” in the U.S. and sees financial, tech, and military conflicts brewing globally.
- Portfolio Moves: Bridgewater Associates has leaned into broad market ETFs like SPDR S&P 500, signaling a more diversified, cautious stance.
- Outlook: Dalio is focused on systemic risk and believes investors should brace for non-financial shocks as well.
Stanley Druckenmiller: Tactical Rotation into AI
- Exited Nvidia and Palantir: Despite early gains, Druckenmiller sold 100% of his positions in both due to valuation concerns.
- Betting on Microsoft: He’s shifted into Microsoft, citing its OpenAI stake, Azure growth, and strong earnings as better AI exposure.
- Portfolio Shifts: He’s also added Entegris, Warner Bros. Discovery, and Insmed, while trimming Coupang and exiting 15 other holdings.
- Outlook: Druckenmiller is bullish on AI and precision medicine, but highly selective. He’s not afraid to pivot quickly.
What This Means for You
- Buffett’s caution suggests it’s wise to hold cash and wait for better entry points.
- Dalio’s warnings highlight the importance of hedging against macro and geopolitical risks.
- Druckenmiller’s agility shows that even in frothy markets, there are pockets of opportunity -- if you’re nimble.
So the bottom line here is that you don’t need to have a crystal ball to make money with your trading. We can help you navigate the markets based on probabilities and the likelihood of certain sorts of market action. Over the coming weeks we will introduce some of these strategies to you. To the extent you want to focus on more immediate directional plays, we are going to start layering in some technical signals to help you identify shorter-term trade ideas. For now, please heed my warning about the growing dangers in the stock market. Yes, the current AI mania might be a very different sort of animal from the Dot.com bubble, but that doesn’t mean that the current valuations are justified.
It is always dangerous to try to pick a top in a roaring bull market, so in case you want to play for a reversal, I strongly recommend using limited risk option strategies. For example, given the volatility skew in put options on the S&P500, I would suggest that you consider a very simple downside butterfly trade in case you want to play for a move lower of four percent or five percent over the next six weeks. An example of such a trade might be the purchase a butterfly on S&P options for December 19. In this trade, we might buy 1 6600 put, sell 2 6500 puts, and buy 1 6400 put. The net cost is about 3.35. If the market drops by several percent over the next two weeks, then we would just about double our money on the trade. If we get a sharp down move of 4% in the market over the next four weeks, then the butterfly’s value would jump up to about 13.25. If the market has a sell-off all the way to the 6500 level during this period, then the spread would be worth about 23. The maximum potential value of the trade at maturity is 100 for each butterfly. In case you are bearish, the risk-reward is excellent.
That said, the coming months present numerous exciting opportunities. In the meanwhile, I want to wish you the very best of luck in navigating these dynamic markets.
Andy Krieger