These Huge Market Distortions Indicate Vulnerabilities (and Opportunities)
The last time we had a divergence this pronounced was in 2000, right before the Nasdaq dropped 83% from its highs.

In this article:
- The problem with inflation and the Fed's balance sheet
- Worrying divergences in US stocks indicating a bubble?
- Similarities to my famous New Zealand dollar trade
- Potential trade opportunities and their triggers
Thoughts on the Market - February 5, 2024
In my last write-up, I discussed how this past week was going to be full of important economic data and associated market risks. In fact, the numbers didn’t disappoint, as we had a week of outlier data, with the nonfarm payroll data being particularly shocking. The idea of a March interest rate cut by the Federal Reserve Board has been largely crushed by surging employment growth and much higher than expected hourly wage data. Powell has effectively confirmed that a rate cut at this time seems quite premature.
I have maintained for a long time that inflation would prove to be stickier than we would like, so I wasn’t particularly surprised by the much higher hourly earnings. The initial surge in inflation a few years ago was a natural by-product of supply chain shocks, huge government deficit spending, and the Fed going wild with monetary easing.
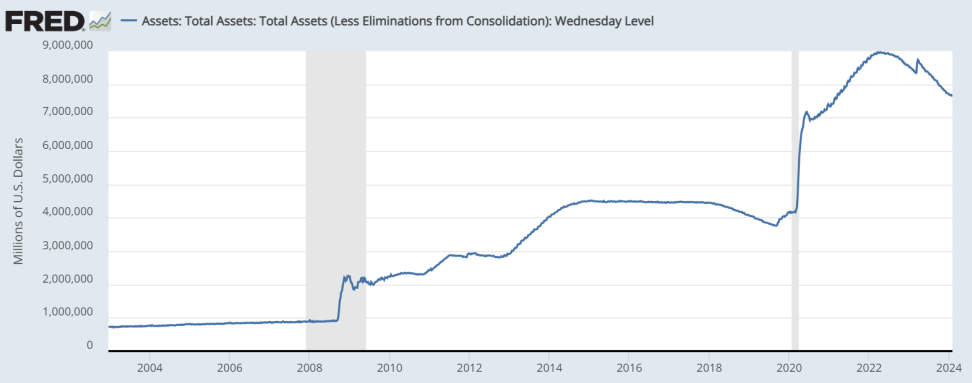
One doesn’t need to be a brilliant macro-economist to understand that when the Fed increased their assets by 127% in less than two and a half years, there was bound to be a notable effect on the economy in general, and on inflation in particular. We were in the latter stages of a long-term disinflationary cycle, so the dramatic increase in the Fed’s balance sheet from the early 2000’s until 2019 didn’t previously show up as sharply higher inflation. The cumulative effects, however, finally manifested in 2021. Inflation was hardly transitory. Looking at the Fed’s monetary easing over a twenty-year period, it is even easier to understand the current levels of inflation in the system. The Fed increased their balance sheet 1144% from 2002 until 2022.
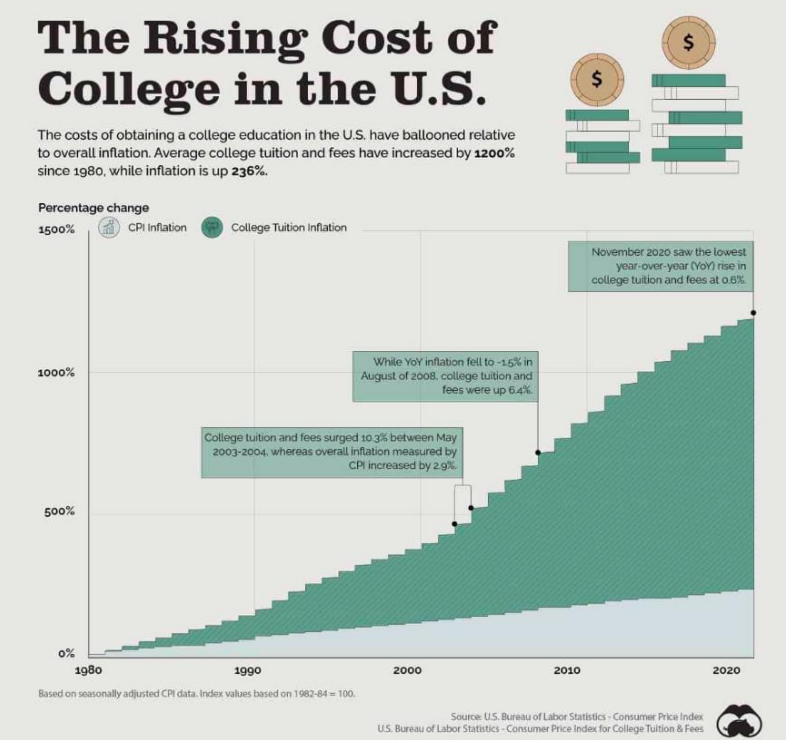
This injection of money into the system has led to all sorts of distortions, from food and housing prices to medical services and college educational costs. Gold surged from $270 per ounce to $2025 per ounce during this period as a further measure of the depreciation of the value of the US dollar. If we think about gold as a form of money, and we see the huge increase in the volumes of US dollars pumped into the system by the Fed, then it is easy to understand why gold has had this massive surge in value.
The easiest way to grasp what is happening at a macro level is to think about basic laws of supply and demand. When there is a sufficient increase in the quantity of a good, the value of that good will, at some point, depreciate. Money is no different. We have had an enormous increase in the amount of money in the system, so the purchasing power of the dollar has depreciated. The Fed has been targeting an annual inflation rate of 2% for decades now. While this doesn’t sound like a dramatic depreciation in the value of the dollar’s buying power, it means that the dollar loses half of its value every thirty-five years. In fact, the inflation rate has been growing a bit faster than that, so people’s buying power has been decreasing at a slightly faster rate.
Returning to the concept of the boiled frog syndrome, although people’s money has been losing a little more than half of its buying power every thirty-five years, this is a slow and steady depreciation, so people don’t react aggressively to this loss of value. Essentially, people don’t typically notice the effect of inflation unless the numbers suddenly spike higher, as they did in 2021 and 2022. Otherwise, people just adjust to the higher costs of goods over time without too much complaining, effectively ignoring the steady pain of being slowly burnt by a steadily depreciating currency. As long as wages more or less keep up with the loss of the dollar’s buying power, people will gripe a bit, but they won’t scream and shout.
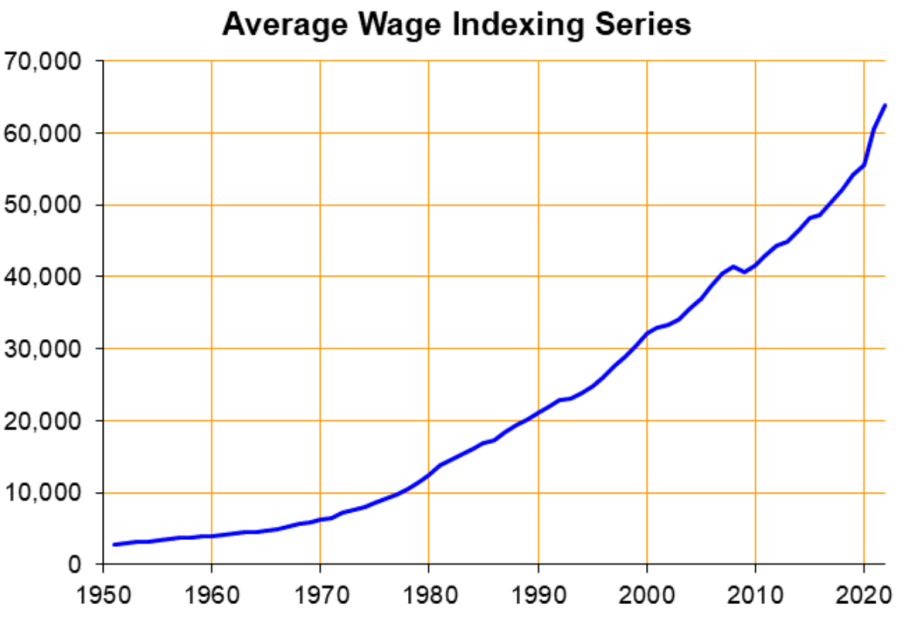
Politically, this artificial system works well since a modest rate of inflation gives many people the false sense that they are doing better because their salaries are increasing at a slightly faster rate. Their homes and their other assets are also increasing in value because of the weakening dollar, so the 2% annual depreciation is bearable.
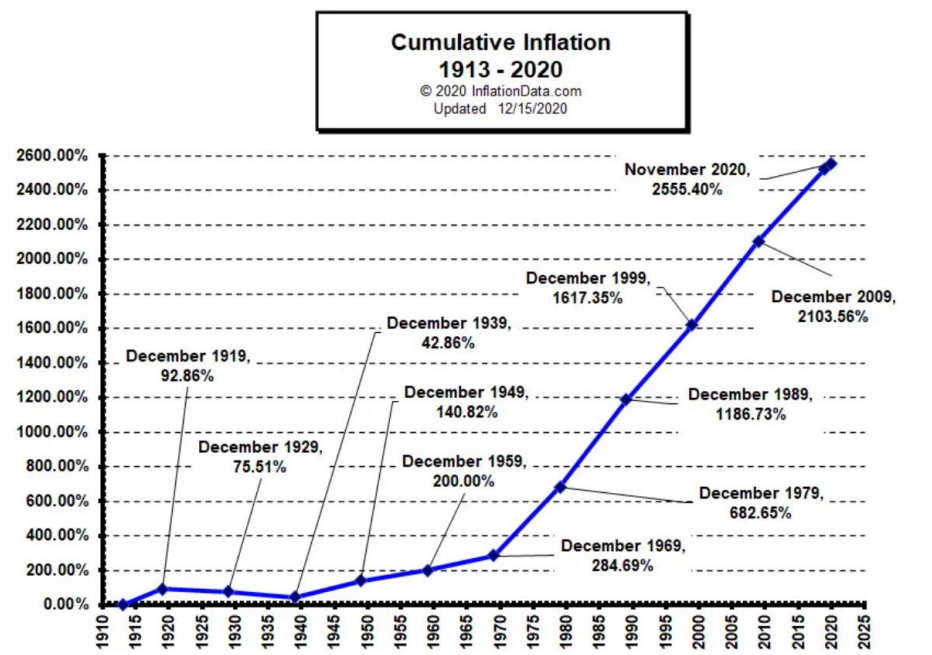
As you can see in this long-term chart, the dollar’s value has depreciated enormously over the past 113 years. The depreciation accelerated enormously during the Viet Nam era, and then even more dramatically once the US abandoned the gold standard and shifted to an untethered fiat currency system in the early 1970’s.
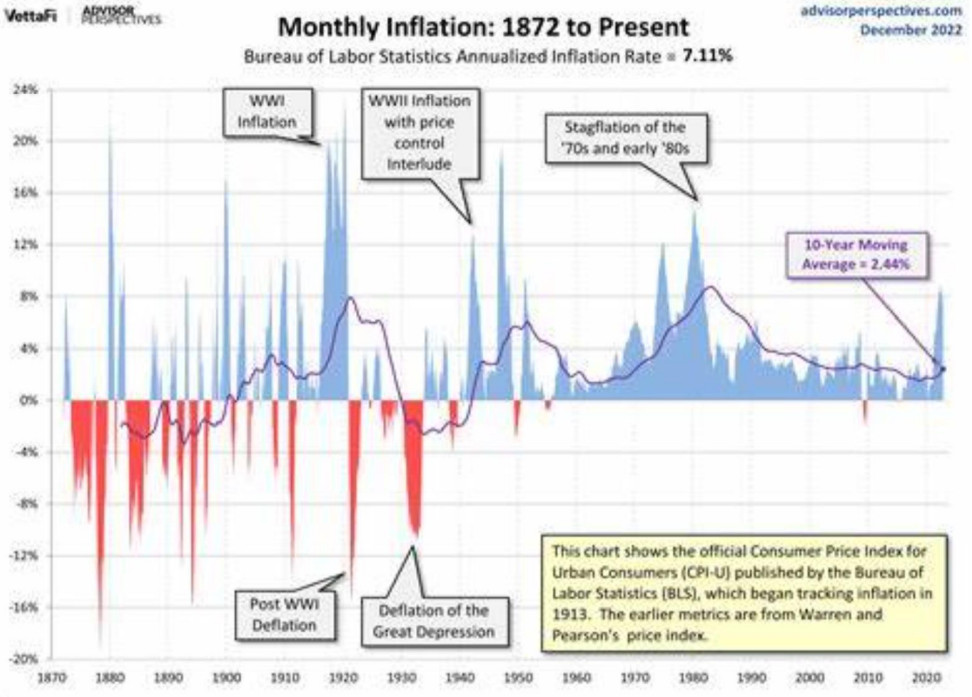
This steady erosion of the dollar has helped us avoid some of the crushing deflationary cycles that were all-too frequent in the 1800’s (see the chart from 1872 below), but it is foolhardy to think that the system is rock solid and built on an inviolable base. The current monetary system is built on trust and faith, the current levels of Federal debt are starting to test that trust and faith. The United States is on an unsustainable path with regard to its national debt. If the pace of debt creation continues at the current pace, then at some point we will find ourselves in a very, very frightening period. It takes an enormous amount of trust in the system to keep purchasing trillions of dollars of debt from a government which seems to have no sensible spending constraints.
It is natural that the Fed’s policy of “kicking the can down the road” is so entrenched now. The last thing the Fed wants is to awaken the marketplace to the not-so hidden dangers lurking beneath the surface. The Fed’s balance sheet has exploded over the past twenty years in its efforts to mask a series of very serious problems. The debt crisis of 2008 nearly crashed the banking system. Now the Fed and the US banking system is sitting on trillions of dollars of fixed income securities that are way underwater. Lower interest rates will help heal that problem, as the marked-to-market problems will largely disappear when rates in the US drop sufficiently. The total volume of the debt and the interest payments to cover the debt, however, won’t disappear.
The problem is not only a US problem. Europe’s experiment with negative interest rates has also led to a gigantic accumulation of underwater securities that are yielding interest rates that are way below current market levels. This equates to huge unrealized losses on the securities they hold. Whether we are looking at Germany or elsewhere in Europe, all of the authorities are anxious to have the chance to take interest rates lower. Ideally, they would like to do so sensibly, but it remains to be seen how quickly they can do that. For sure, the Fed, the Bank of England, and the ECB have all let us know they would like to be able to reduce interest rates as soon as feasible given the easing of inflationary pressures.
The US is a bit of an anomaly since the job market here is so strong. Wage pressure is still strong with the unemployment rate near all-time lows at 3.7%, and the annual GDP still chugging along at an annualized rate of 3.3%. What remains to be seen is whether the US is on a sustainable path.
Last year, the pundits were unanimously calling for a recession due to a variety of factors, not least of which was the inverted yield curve. The inverted yield curve has been a quite reliable harbinger of a coming recession with a typical six-to-twelve-month lag time once the longer-term rates drop below the short-term rates. What these analysts missed was the fact that the markets were distorted to some large extent because the supply chains were out of whack for several years and they were normalizing. If the price distortions had been primarily demand-related, then the inverted yield curve would likely have resulted in the forecasted recession.
Does this mean I am expecting a possible recession over the coming year? In my view, the chances are rising, and they are certainly higher than they were a year ago.
In the meanwhile, the stock market continues to power on to new all-time highs in the Dow Jones and S&P. From the end of the third quarter of 2023 up until January of 2024, the market participants were all excited about the Fed lowering rates. There was a growing consensus that the Fed was going to cut rates in March of 2024 and then continue cutting during the year, bringing the Fed Funds rate down to about 3.75%.
Chairman Powell has poured sufficient cold water on that idea, so the market is now focusing on new excuses to keep plowing money into the equity market. Objectively, I find this dynamic fascinating. The fear of missing out is driving people to keep buying and buying, regardless of the underlying reasons. That in and of itself is fine, because ultimately markets are flow driven, but I wonder how many speculators who are limit long stocks have had a look at the performance of the broader stock index recently.
Please consider the following charts of the Russell 2000 index and the Nasdaq. I find the divergences in their relative performances fascinating. The Russell 2000, a very broad index that includes 2000 companies, is down over 20% from its peak in 2021. At the same time, the Nasdaq is up over 5% during the same time period. The Dow Jones Industrial Average and S&P 500 are likewise posting new all-time highs. Clearly, the broader index is telling us a very different story than the more concentrated indices. In my view, either the Russell 2000 needs to surge to get back in line with the more concentrated indices, or the Russell 2000 is telling us something about the state of the broader market here in the US.
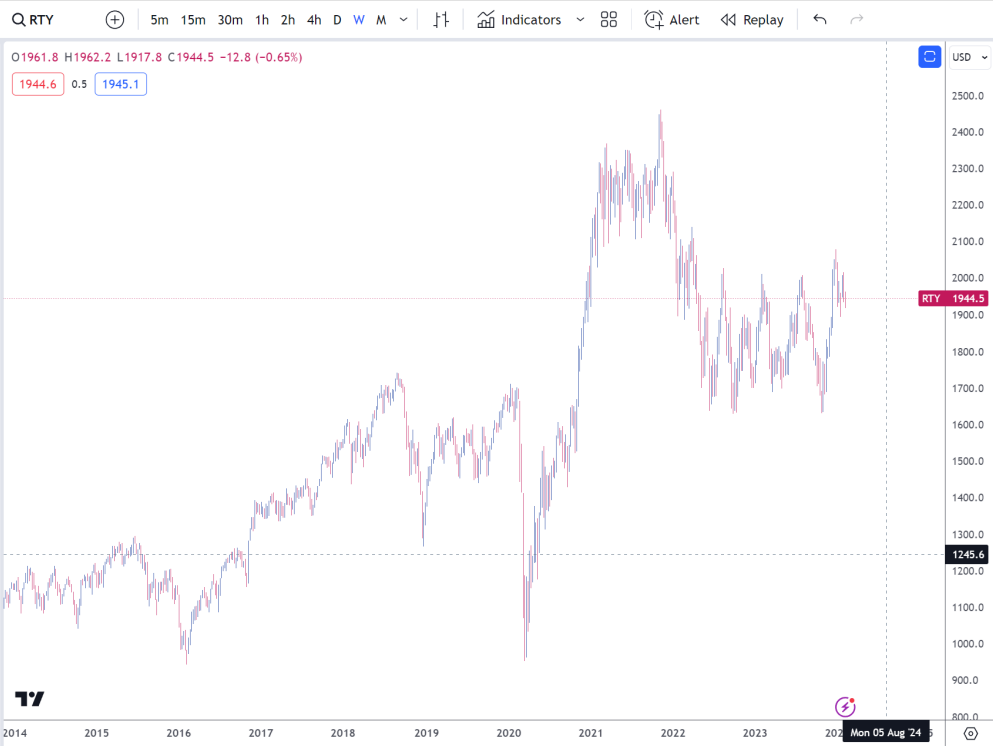
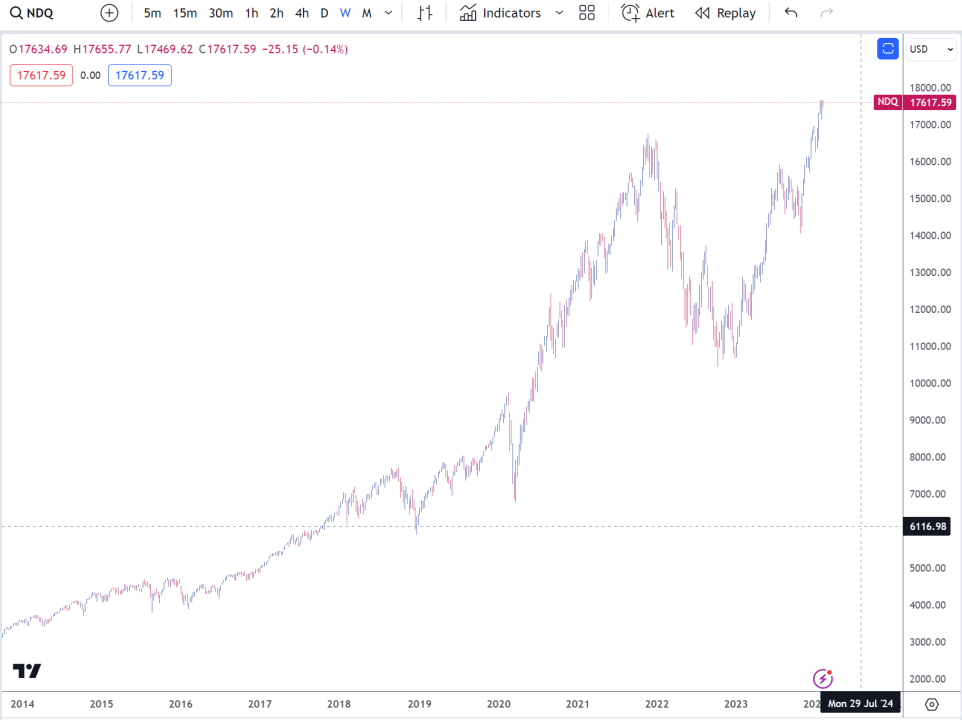
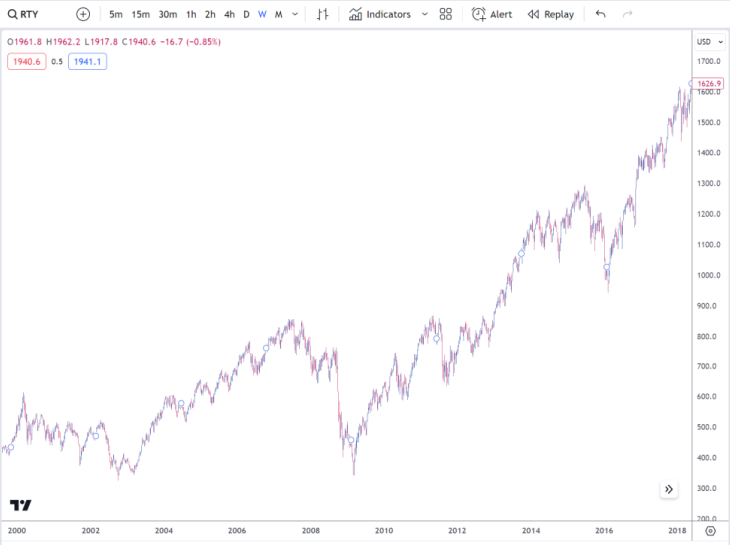
The last time we had a divergence this pronounced between the indices was back in 2000, right before the Nasdaq dropped by some 83% from its highs. It took sixteen and a half years for the Nasdaq to regain its peak levels from 2000. It took the Russell Index about four and half years to regain its prior highs. This sort of divergence only occurs after a massive bubble, and I would maintain that we are in a bubble of historic proportion right now. I am not suggesting that this bubble is about to burst, but I am absolutely saying that it will burst at some point, and the aftermath will be very ugly. There are gross distortions in the system right now, and distortions indicate vulnerabilities.
The two charts below show how long it took for the markets to recover from the dramatic selloffs in 2000. Clearly, the Nasdaq, with its parabolic rise and fall took much longer to recover.
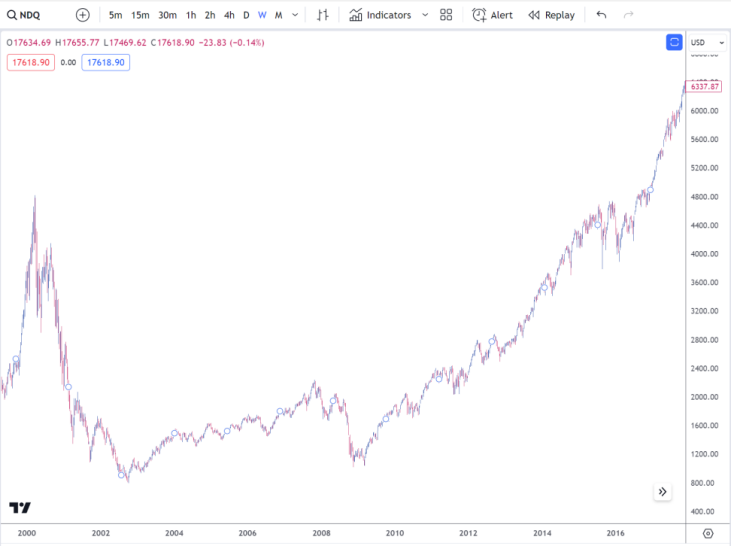
At some point, I will start building up a large option bet to play for a gigantic correction in the Nasdaq. I would only play for this sort of move through a limited-risk option strategy, as bubbles can persist for a very long time, and extend to prices that seem absurd. The probabilities of a fierce down move, however, increase with each further spike higher in prices. The current slope of the rallies is not sufficiently parabolic that I want to rush out immediately and play for a major move lower, but the US equity market definitely has my attention.
Over the coming months, I expect the US economy to slow, perhaps quite a bit. I felt that the stock market declines that ended abruptly in early 2023 were forestalled because of the rapid advances in artificial intelligence. AI is something that will continue to play an increasing role in our lives over time, but there is too much optimism about it right now. Although its impact will be powerful, its expansion brings with it some serious downside risks. Massive job losses will be inevitable, so large-scale job retraining will be necessary. Change rarely comes painlessly, so we should not expect only positive outcomes to follow.
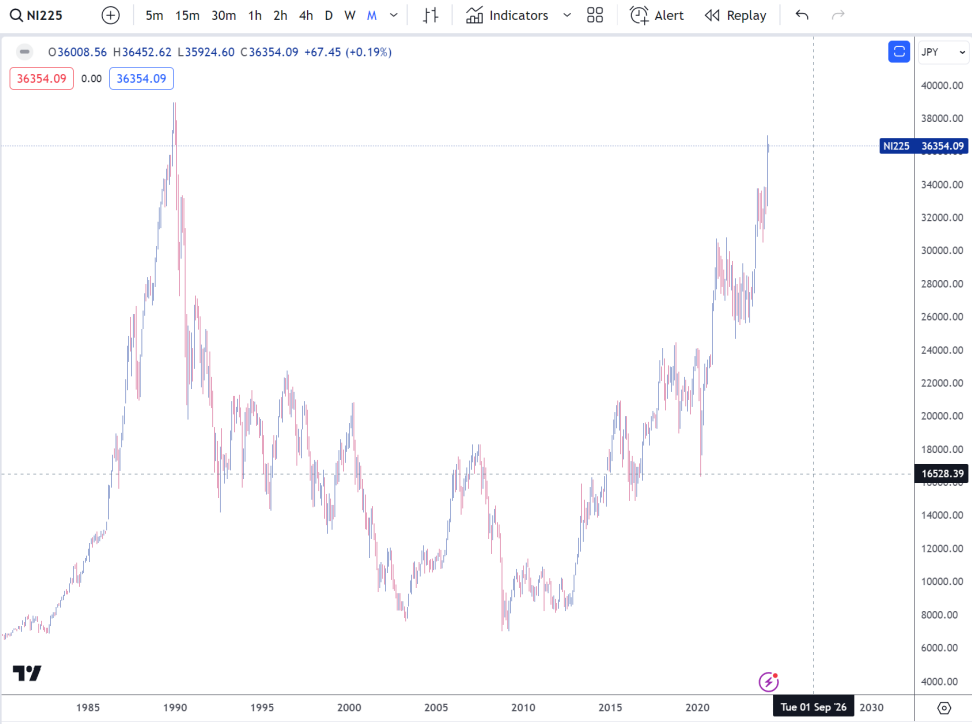
The chart below of the Nikkei is very illustrative of how long it can take a market to recover after a bubble bursts. The Nikkei reached its peak of nearly 39,000 in January of 1990. Thirty-three years later it is finally approaching its prior highs!!
We should never underestimate the pain that the piercing of a bubble can inflict on those who have a huge fear of missing out!! The mentality of US equity market participants now reminds me of the sort of thinking that convinced me to sell billions of New Zealand dollars in 1987. Traders in every time zone told me that they were bullish on the Kiwi because the soon-to-be reported inflation data would likely be terrible, forcing the RBNZ to hike interest rates further. That in turn would lead to more capital flows to buy the Kiwi to earn the higher yield.
When I asked these traders what would happen if the inflation data came in better than expected, they unanimously told me that better inflation data would mean better fundamentals. This in turn would lead to more buyers of the currency to participate in the improving economy. Wow!! My immediate thought was this is a bubble that is going to burst. Markets don’t offer us win-win situations with guaranteed upside no matter what. The technical situation supported the view, as the currency was way overbought after having rallied by more than 40% in a year. The subsequent peak in the middle of 1988 proved to be an even better short, but the sell-off in October of 1987 was still a clear play with excellent probabilities on my side.
The surge in stocks that we have witnessed since the 23rd of October last year was fueled by an astonishing level of optimism about imminent rate cuts from the Fed. The S&Ps, for example, rallied 21% from that day until the 29th of January 2024. I can understand some optimism, although that is extreme considering that the market was rallying all year despite interest rates having gone up 500 basis points since the spring of 2022. What I can’t understand is why the market has continued to hold its level and even rally a bit in the face of shockingly strong economic data that more or less crushed the likelihood of a Fed cut in March. I guess one excuse is as good as another.
The speculators, in their near infinite optimism and fear of missing out, deftly shifted buying stocks because of lower interest rates to buying stocks because of surprising strength and resilience in the economy. Cynically, I would suggest that they might also buy stocks when massive job layoffs are announced because that would improve the bottom line of the companies that are forced to fire tens of thousands of employees.
People are buying because they are buying, and that will work until it suddenly isn’t working anymore. When this sort of mania takes hold in a market, there is typically a selloff to follow that will range from 10% to 30% over a six-to-eight-week period once the decline starts. What will the trigger be? We don’t actually need a trigger. My guess is that we will try to assign a cause to the move after the move is well underway, or perhaps even when it is done.
Depending on the overall market situation, this move could then be followed by further selloffs, but it is too early to forecast that. If I were to bet on a trigger, I would guess that it won’t necessarily be directly related. For example, it could be a further meltdown in Chinese equities and the Chinese economy. This in turn could easily fuel a more general risk-off environment in multiple markets. Currency-wise, it would likely lead to a sharp appreciation in the Japanese yen on the crosses, but its impact on the US dollar won’t be clear. It is premature to say.
The recent sales of yen crosses that I made are working out just fine. The pound, euro, and Canadian dollar have all weakened against the yen, and I have added a short Aussie bet against the yen as well. I am waiting to build up a short position in the dollar versus the yen. Right now, the short dollar yen exposure is tiny because dollar yen might have a bit more upside before it reverses. The cross plays are clearly a better play for right now.
In the commodities, oil continues to gyrate quite wildly in a ten percent range. It isn’t really going anywhere, so it isn’t clear whether it is really bottoming or not. Gold continues to hold its level above the recent swing low at $1973. I think it is still consolidating its sharp rally from $1810 up to its spike high at $2146. This is one of those instances of a market correcting a sharp move through time, rather than price.
I hope you are all faring well in the markets. Wishing you the best of luck.
Andy Krieger