Market Stress Report: Structural Weakening, Volatility Dislocation, and the Rising Risk of a Global Air Pocket Decline
Thoughts on the Market
March 16, 2026
1. Executive Summary
The U.S. stock market has entered a phase of structural fragility. Friday’s close directly on the 200‑day moving average signals a loss of trend integrity and a deterioration in internal bid strength. Implied volatility has surged to levels far above realized volatility, reflecting aggressive hedging demand against downside market risk and a developing shift in investor psychology toward protection rather than risk‑taking. With the index hovering just above the multi‑month double bottom at 6500, the probability of a disorderly break — an “air‑pocket” decline — is rising sharply. In the very short term, the market is a bit oversold and due for a bounce, but the risks for a downside acceleration are rising.
Simultaneously, the yen is emerging as a potential secondary global accelerant. BOJ intervention risk is rising, inflation pressures are building due to higher oil prices, and the multi-trillion‑dollar yen carry trade is increasingly unstable. This may seem counter-intuitive
given the fact that Dollar Yen is trading just below a multi-year, multi-decade high, but in fact that merely increases the risk of official intervention to reverse the yen’s weakness. A sharp yen reversal would amplify global volatility and could trigger forced selling of a wide range of U.S. dollar assets by foreign investors, who collectively hold roughly $18 trillion of U.S. equities.
The combination of technical fragility, volatility mispricing, FX instability, and geopolitical uncertainty creates a regime where downside tail outcomes are no longer tail events but plausible near‑term scenarios.
2. Technical Structure: A Market Losing Its Grip
2.1 The 200‑Day Moving Average as a Final Support Line
Friday’s settlement on the 200‑day moving average is a sign of exhaustion, not resilience. The market has:
- Failed to sustain rallies
- Printed progressively lower highs
- Lost the internal momentum that previously supported dips
A decisive break below the 200‑day moving average would confirm a transition from distribution to liquidation. We need to pay close attention to the market’s inevitable correction action around this level. If a bounce is met with aggressive strong selling, then the odds of a test and eventual break of the key 6500 level rise significantly.
2.2 The 6500 Double Bottom
The multi‑month double bottom at 6500 is the last meaningful support before a structural vacuum. If this level breaks:
- Systematic strategies (CTA, vol‑control, risk‑parity) will mechanically be forced to sell and de‑risk
- Dealer gamma is negative, thereby creating a difficult position to manage in a declining market as the dealers get progressively shorter the market as it declines, thereby amplifying the downside
- Foreign investors — holding $18 trillion in U.S. equities — may become forced sellers if they decide to reduce their exposures and balance out at least a portion of their U.S. risk
- Liquidity will thin rapidly
A break of 6500 is not a technical event; it is a liquidity shock.
3. Volatility: Implied Far Above Realized — A Classic Warning Signal
3.1 The Dislocation
Implied volatility is trading at a large premium to realized volatility. This reflects:
- Heavy demand for downside hedges
- Dealers short gamma and short vega
- A market pricing discontinuous outcomes
This is classic pre‑air‑pocket set-up. It is a market condition in which selling begets more selling.
3.2 Why It Matters
When implied volatility spikes before realized volatility catches up, it often precedes:
- Sharp repricing events
- Liquidity gaps
- Disorderly declines
The volatility market is signaling that participants see structural stress beneath the surface.
4. The Air‑Pocket Risk: Anatomy of a Disorderly Decline
An air‑pocket decline occurs when:
- Liquidity providers withdraw
- Dealers are short gamma
- Systematic strategies sell mechanically based on momentum-based models
- Foreign investors hedge or repatriate
- Macro catalysts accelerate the move
All five conditions are present or emerging.
4.1 The Setup
- Weakening up-trend structure
- Key support directly below
- Volatility dislocation
- Rising geopolitical and FX uncertainty
- Positioning asymmetry
- Market reprices lower stock multiples
4.2 Downside Destinations if 6500 Breaks
If 6500 fails:
- 6100–6200 is the first structural shelf
- 5400-5800 area of congestion
- 4800 (December 2021 market high and April 2025 panic low) becomes the next major magnet
- 4100 opens if liquidation accelerates and key support at 4800 gives way
These are not forecasts — they are the logical endpoints of a market with no support and forced sellers dominating flow.
5. Foreign Ownership: The $18 Trillion Wildcard
Foreign investors hold roughly $18 trillion of U.S. equities. Their behavior is tightly linked to FX volatility and hedging costs. (They also holds trillions of dollars of U.S. fixed income securities, but the bonds have been weak, but not overwhelmingly so.) A portion of the foreign investments in U.S. equities is funded by the yen carry play, so that dynamic creates an added downside risk to U.S. equities.
If yen interest rates rise and USD/JPY volatility rises:
- Hedging becomes more expensive
- FX‑adjusted returns deteriorate
- Risk budgets shrink
- Foreign selling accelerates, even if it is only a modest percentage of the total $18 trillion basket, it is still a massive sum
If the S&P 500 breaks down hard, foreign investors could become forced sellers, amplifying the decline.
6. The Yen: A Growing Source of Global Instability
6.1 Rising Risk of Serious BOJ Intervention
USD/JPY is approaching levels where the BOJ and Ministry of Finance have historically intervened decisively. The 160–161 zone is politically and economically sensitive. A disorderly move through this region could trigger:
- Large‑scale FX intervention
- Multi‑figure reversals
- A sharp tightening of global financial conditions. Remember, Japan is the world’s largest foreign creditor. They have many trillions of dollars invested around the world
The probability of forceful BOJ action is rising materially.
6.2 Oil Near $100: BOJ May Be Forced to Tighten Sooner Than Expected
Japan is highly exposed to energy prices. With oil trading close to $100:
- Imported inflation accelerates
- Real incomes fall
- Political pressure intensifies
The BOJ may be forced to tighten more aggressively to choke off inflation, a scenario markets are not priced for. A faster tightening cycle would:
- Narrow the U.S.–Japan rate differential
- Undermine the yen carry trade
- Increase the probability of a violent unwind
6.3 Japan’s Potential Turn Toward Militarization
For the first time in over 80 years, Japan faces the possibility of shifting toward militarization as a form of economic stimulus. Since the end of World War II Japan has maintained a strict self-defense posture. A deviation from this stance would:
- Expand fiscal deficits
- Increase bond issuance
- Force adjustments to BOJ policy
- Raise FX volatility
A militarized Japan would be a structural regime shift — and likely yen‑positive.
6.4 The Multi-Trillion‑Dollar Yen Carry Trade: A Powder Keg
The global yen carry trade spans:
- USD
- MXN
- AUD
- EM FX
- Global credit
- High‑beta equities
When the yen strengthens sharply:
- Carry positions become unprofitable
- Margin calls cascade
- Forced unwinds accelerate
- Cross‑asset volatility spikes
This is one of the most underpriced global macro risks.
6.5 Yen Volatility Is Rising — and We Are Positioning Patiently
Yen volatility has been rising steadily. We have been patiently preparing for a shift toward a bearish USD/JPY stance. The setup is improving rapidly, and the catalyst window is widening. We are close, but waiting for the optimal entry point remains the correct strategy. Our yen positions are a bit long volatility with only a tiny yen directional bias. We will shift to an aggressive long yen bias once the huge, global short yen unwind begins
7. Geopolitical Miscalculation and Domestic Fragility
The U.S. has blundered into a conflict with Iran that offers no clean victory and no painless exit. The strategic miscalculation — underestimating Iran’s willingness to absorb punishment and overestimating the deterrent effect of U.S. strikes — has raised geopolitical stakes at precisely the moment when the U.S. economy is already under strain.
Iran’s strategy is built on attrition and cost asymmetry: cheap drones versus expensive U.S. interceptors, persistent pressure on the Strait of Hormuz, and a willingness to endure economic pain in service of national independence. This is a civilizational time horizon the U.S. political system is not built to match.
The result is a strategic bind:
- Escalation risks a wider regional war and higher oil prices
- Freezing in place looks weak
- Declaring victory would be hollow and transparently political
Without physically removing the high-grade nuclear material from Iran, it would be difficult to convince allies and foes alike that the key U.S. objectives have been met. Clearly the negotiations that were aimed to limit Iran’s nuclear program in exchange for sanctions relief did not go well, and the current war will simply further motivate Iran to develop a nuclear arsenal. Moreover, Iran can always rebuild its missile and drone arsenal over time, but regime change will be very difficult to achieve. This is an existential moment for Iran, not a strategic one, and the U.S. clearly miscalculated the power behind that imperative.
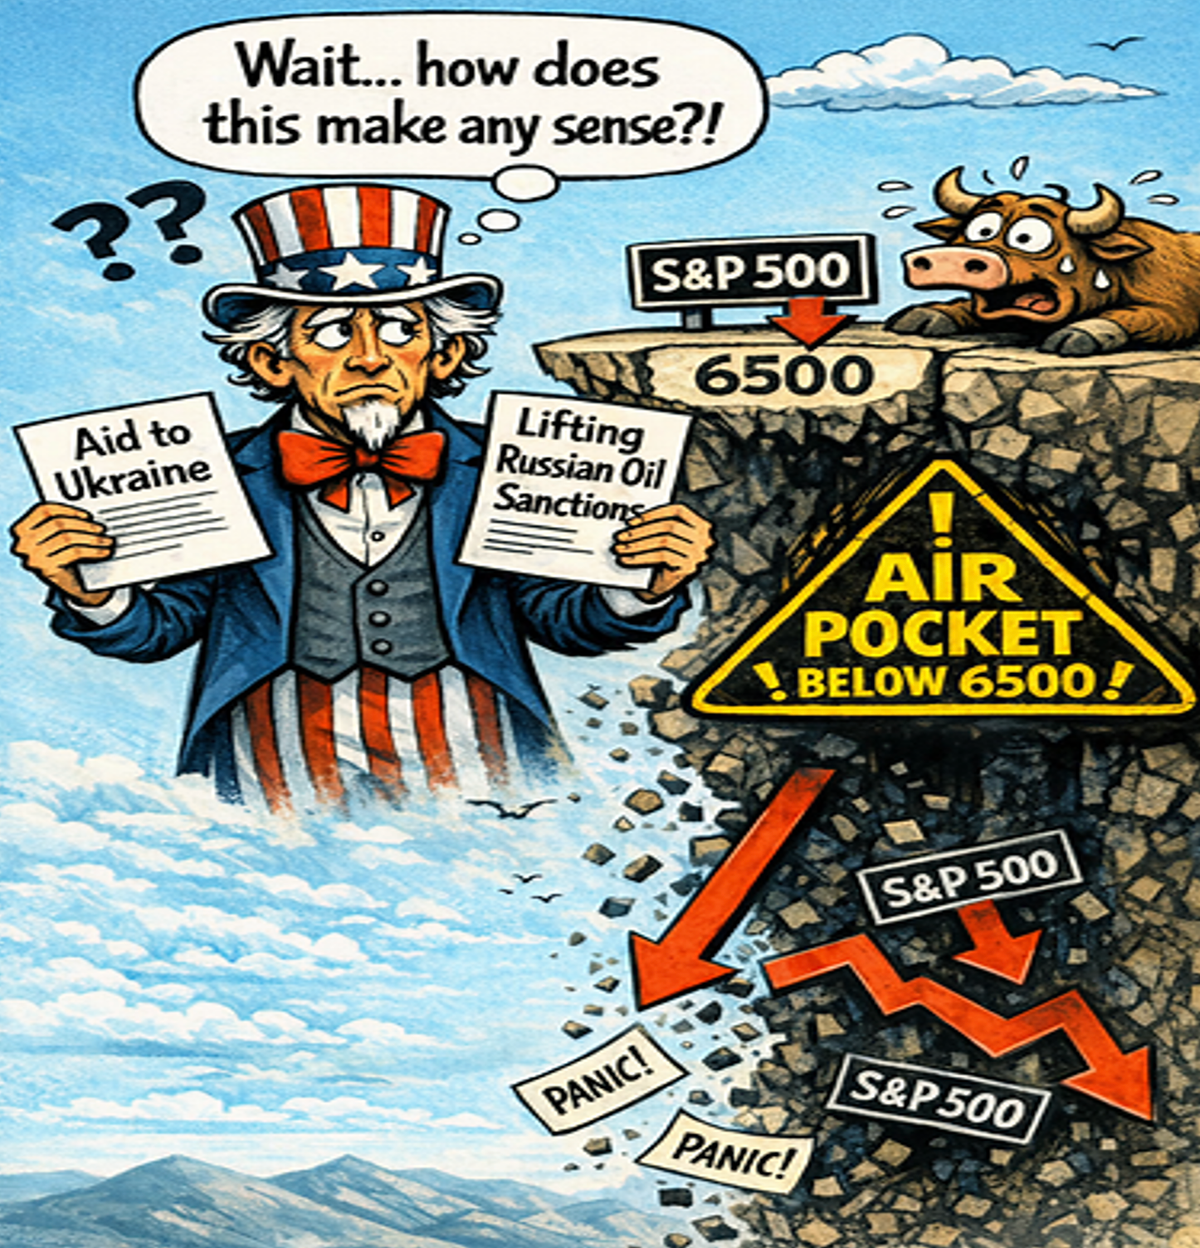
Compounding this is a glaring contradiction in U.S. policy: Washington is simultaneously supporting Ukraine in its war against Russia while easing sanctions on Russian oil, allowing Moscow’s primary revenue stream to flow with fewer restrictions. This move is contradictory and frankly, appears desperate; it is a de-facto admission that the U.S. economy cannot afford a global oil shock. To allies and adversaries alike, removing Russian oil sanctions signals strategic incoherence by leaders and points to their fears that the U.S. economy lacks resilience. It is important to remember that all of this is occurring with the backdrop of a softening labor market in the U.S.
This combination of external overreach, internal fragility, and policy inconsistency materially increases downside risk for U.S. equities. It also undermines confidence in the dollar over time, as global observers see a U.S. that appears overextended, economically constrained, politically divided, and frankly, operating with no obvious signs of long-range planning or strategy.
The U.S. is already seeing how reluctant their allies are to commit military support to a war they didn’t endorse or start. Keeping the Strait of Hormuz open will require a significant military presence, yet this is exactly what Americans were assured would not happen under a Trump administration. I think it’s fair to say that most people intuitively understand that killing foreign leaders and destroying much of their military infrastructure does not automatically equate to a victory, especially when the aggressor has never defined its goals.
Because of this, the geopolitical backdrop is no longer a tail risk — it is a core driver of political market vulnerability.
8. Bottom Line
The market is perched on a knife’s edge. Technical structure is weakening, volatility markets are flashing stress, the yen is potentially going to become a global accelerant, and geopolitical miscalculation is amplifying domestic economic fragility. Foreign ownership of U.S. equities introduces a powerful second‑order risk that could turn a correction into a large-scale liquidation.
The probability of an air‑pocket decline is now materially elevated.
I recognize that this is not a very uplifting, happy report, but my job is to help you navigate some very tricky markets, not try to make you feel good. I hope that you find this analysis helpful. As always, Imre and I welcome your feedback, and on a select basis, we are happy to offer specialized consulting and advisory services to help you further with your trading and investments.
Andy Krieger
Please find Imre’s market analysis below:
My Framework
I treat markets as auctions, not prediction machines.
Most sessions on a day-to-day basis are balanced.
Edges form at the extremes of value.
I trade acceptance and rejection at those edges.
If value migrates, I align with it.
If it fails, I trade the rotation.
I am not in the business of forecasting.
I am in the business of validating participation.
_________________________________________________________
Monday's hard test of the 200-day moving average set the tone for the week. The market bounced and rotated back into a prior high volume node between 6882 and 6830. That rotation was the most important event of the week.
Acceptance within that node would have signaled a return to balance. Buyers and sellers finding agreement at familiar prices again. Sellers had other plans. They came back in and drove price lower. We closed the week near Monday's low of 6584.
That level deserves your full attention.
It sits on the 200-day moving average and marks the upper edge of a high volume node. Below it is a low volume corridor with very little to slow price down until 6483. Think of it like a highway with no traffic. Once congestion ends, speed picks up fast.
If buyers can't hold 6584, that's where we're likely headed.
If they can, rotation back toward prior value areas becomes the play. First target is 6701 to 6717. Above that, 6769.50. And above that, the node sellers used as a ceiling last Tuesday — 6830 to 6882.
6584 is the number to watch this week.
During the last week of February, gold gapped up strong but failed to auction to new all-time highs. Instead, price established a high and built a high volume node between 5440 and 5377. From there, we rotated back to the familiar key level at 5110.
When a market like gold, which has every reason to rally, fails to do so, it is certainly worth paying attention.
This past week was potentially decisive. We broke and closed the week below 5110. The path of least resistance now points lower.
That said, sellers need to keep the pressure on. A weak market rotates down to the next major high volume node, spanning 4626 to 4582. A strong market reclaims 5110, then pushes through the minor high volume node between 5208 and 5166. In that case, another test of the all-time highs remains in play.
Crude oil is next. This is the monthly chart, spanning roughly a decade of price history.
Over that time, the market has determined fair value exists between $45 and $75 a barrel. That is the accepted range. That is where price has lived.
This is not the first time geopolitics has blown that range apart.
In February 2022, Russia invaded Ukraine. Crude surged violently, pushing into the $120s. It was an emotional, event-driven move. Buyers chased the headline. Price reached historically unfair levels. But the market could not build acceptance there. Participation dried up. Eventually, price rotated all the way back into the fair value range.
The current situation rhymes. U.S. and Israeli military action against Iran has once again lit the fuse. Crude surged in historic fashion, including what was reported as the largest single-week price increase on record during the week of March 2.
What happens next depends on one thing. Can the market build acceptance above $75?
Geopolitical events can light the fuse. But emotional, event-driven surges are ultimately unsustainable. The market always has to come back and answer a simple question. Where is fair value now?
That answer comes through acceptance. Price has to spend time in a new range. Buyers and sellers both have to participate. Only then does a new equilibrium form.
Until that happens, trading this move is a dangerous game. The upside can be enormous. But emotional markets make it nearly impossible to identify a level you can confidently lean against. Without a credible stop, you do not have a trade. You have a gamble.
Wait for acceptance. Let the market tell you where it wants to be. Then trade.