Nvidia Isn’t Beyond the Basic Principles of Market Dynamics
Economic cycles have been part of the human experience for thousands of years, we shouldn't imagine these cycles will suddenly end

Another interesting week in the markets. Nvidia finally had a relatively minor sell-off, dropping 15.7% from its all-time high set on June 17. Let’s put things in perspective for this company that used to specialize in graphics and gaming. In March of 2020, the stock was trading at $4.5 per share (on a post-split basis). On June 17 of 2024, the stock was trading at $140.70. In a little more than four years the share price increased more than 30-fold!!
Nvidia was an early developer of GPU technology, and they were able to turn their specialized chips into a successful consumer-oriented product. Its core product, GPUs, was sold as add-ons for consumer computers. Over time, the company has pivoted toward the design and building of specialized chips for advanced computing that can process enormous amounts of data very quickly for what is labeled “artificial intelligence.” This generative AI has facilitated the development of Nvidia into a technology leader with a market capitalization today of $3.1 trillion dollars.
From its humble beginnings from discussions that took place during a meal at a Denny’s restaurant, Nvidia has grown to become the world’s most valuable company. The company is formidable, with excellent financial results, but that doesn’t make it immune to normal market corrections. Remember the US stock markets were in the midst of a vicious sell-off in 2022, in the midst of the bursting of the Covid stimulus bubble, when a new bubble suddenly appeared within the prior bubble – the AI bubble.
The launch of ChatGPT on November 30, 2022, has yielded a bubble with no clear parallels. ChatGPT is a virtual assistant developed by OpenAI that is based on large language models that enable users to refine and direct their conversations with the Chatbot. This was essentially the trigger that launched the AI boom as users found that it could assist with a wide range of activities, from writing poetry and essays, to planning trips.
The basic architecture of GPT-1 (“Generative Pre-trained Transformer”) was introduced in June 2018, and it consisted of 117 million parameters. This enabled vast learning via books and data in order to have predictive capabilities. GPT-2 was introduced about eight months later with 1.5 billion parameters. This was a remarkable achievement and facilitated far more extensive learning capabilities.
GPT-3 followed sixteen months after GPT-2, and it relied on 175 billion parameters. Its capabilities were objectively astounding, as they ranged from letter writing to writing creative poetry. It could even generate programming code and translate between languages. It was during people’s interactions with GPT-3 that the profound applications of this technology became readily apparent.
GPT-4, the latest iteration, is yet another exponential improvement on the prior version. Accuracy has been improved, intentionality of the user is better understood, internet connectivity is possible, so real-time searching is possible, and a host of other innovative applications have been achieved. These developments have expanded the influence of ChatGPT, which in turn has created a pathway for advancements in natural language understanding.
Nvidia’s chips play a key role in AI, and it is clear that AI is going to play an increasingly important role in our society. Among the many various commercial applications are such things as advanced customer service using automated responses to common inquiries, educational advances with tutoring capabilities, creative content production for writers across many industries, enhanced recordkeeping, writing of emails, and the creation of video games. The potential applications are almost endless. These advances, and others, have led to a recognition of the vast commercial applicability of artificial intelligence and AI-powered chatbots such as ChatGPT.
These applications naturally create enormous commercial potential for companies like Nvidia, which produce the high-powered chips required for this extensive computerized data processing. These applications, however, do not permanently alter the basic patterns and principles of market dynamics. Yes, the potential is staggering, but as so often happens with bubbles, markets get way ahead of themselves and reach dangerously overvalued conditions that are unsustainable.
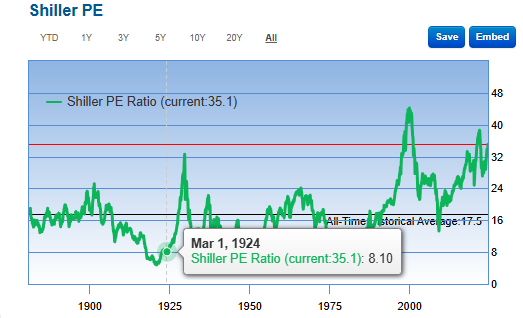
This is where we stand today. The Nasdaq is up 198% since its lows of 2020. The S&P500 is up 150% since then. Nvidia and a limited number of other super performers have lifted the market despite a very narrow level of participation. This growth is absolutely not sustainable! Consider for a moment the following graph of market valuation called the Shiller PE Ratio.
It is a rather simple valuation metric that shows the multiple that the current price of a stock or a stock index is trading over its inflation-adjusted 10-year average earnings. It is a cyclically adjusted ratio which was developed and publicized by a brilliant professor at Yale University, Robert Shiller, in the 1980’s. His work ultimately earned him a Nobel Prize.
Shiller’s ratio is simple, but it is often regarded as one of the most reliable stock valuation indicators. As you can see from the chart below, Shiller’s PE ratio assesses the current market valuation as more overvalued than the stock market was before the 1929 crash. We are still below the levels of the Dot-com Bubble of 2000 and the post-Covid bubble of 2021, but not by much.
Historically, markets can still rally a bit from these sorts of levels, but not on a sustained basis without a subsequent massive correction through either time or price. The only times that markets continued to rally after reaching these sorts of extreme overvaluations occurred in Japan in the eighteen months prior to the Nikkei’s collapse in December of 1989 and the Nasdaq in 1998 and 1999 before the Dot-com bubble burst in March of 2000.
Allow me to clarify further. When markets become extraordinarily oversold or overbought– such as the conditions we have in the current stock market – then there are two ways in which the market can find some sort of sustainable balance. Remember, markets are always seeking a level of balance and equilibrium. This means that markets can move into broad ranges for extended periods of time to correct its extreme conditions. This range trading allows markets to settle down into a new range, but a market that has rallied as dramatically as the S&P500 and Nasdaq markets will need to trade in a broad range for a very, very long time. Think many, many years, not many months, after a multi-year advance of this magnitude.
Alternatively, a market can correct through a price correction, and depending on the severity and timing of this correction, the correction could potentially be relatively short-lived. In this instance, one might expect a correction of forty to sixty percent of the advance, and that sell-off would likely last perhaps half of the time the entire advance lasted. In either instance, the returns for that market would likely be minimal for a very, very long time. The advance that we are going to correct, however, is not just the advance from 2020. We are going to correct a much longer-term, multi-decade advance. Therefore, we need to prepare ourselves for what is going to be a very big correction.
In the current instance, even a fabulous company like Nvidia, with a great business and superior technology, will eventually need to follow the same basic principles that have ruled all markets. It will sell off – a lot. It will hold up better than weaker companies, but don’t buy into the idea that Nvidia is a stock that one should own, not trade. It is not beyond the basic principles of market dynamics. If one studies closely the historical patterns of today’s great companies such as META, Google, Apple, and Microsoft, it becomes quickly apparent that their respective major advances were always followed by extensive corrections. Sure, when one takes a cursory look at the long-term charts of these stocks, the corrective cycles seem modest, like little blips on a chart. Under closer scrutiny, these blips were hardly modest. In fact, they felt downright terrifying during the corrective periods.
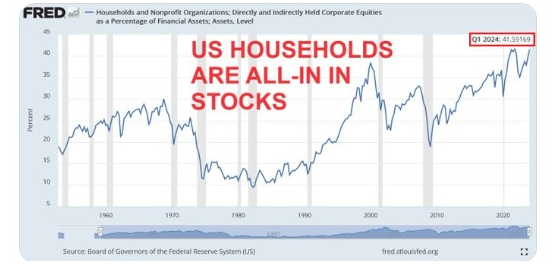
What I am anticipating now, however, is something far rarer and more extreme than anything we have seen for many decades. I don’t often make such bold forecasts, but we don’t often end extended long-term cyclical periods. There are many potential triggers for this massive sell-off, but at the end of the day, one excuse will be as good as another. We currently have the highest percentage participation in the stock market ever in terms of the number of families in America with some exposure – either direct or indirect. We also currently have the highest percentage of wealth that is held by individuals in the stock market. The current level of 41.6% as an allocation to stocks as a percentage of financial assets is even higher than the 38.4% that Americans held in stocks in the late 1990’s prior to the Dot-com collapse in 2000. Unfortunately, in my experience, markets often trigger the maximum level of pain for the maximum number of people. I expect that many people will be badly hurt during the coming sell-off, but the US economy and its resourceful people will recover.
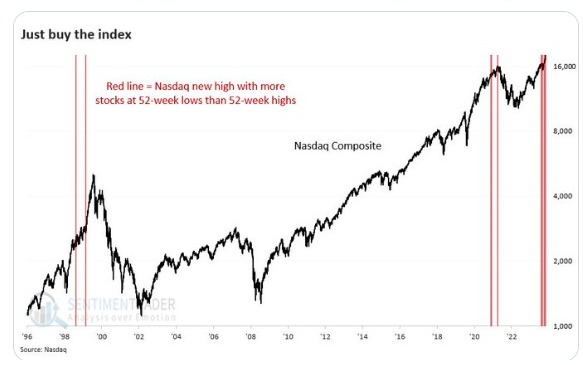
We recently made a new all-time high in the Nasdaq, which had a very rare anomalous situation wherein more stocks made 52-week lows than 52-week highs. This only happened a few times before, and those situations ended in tears. In fact, this anomaly has happened multiple times during the recent string of all-time high days, so clearly the market’s breadth has been very limited. The other recent period when this anomaly occurred was prior to the vicious sell-off from the Dot-com bubble bursting in 2000 and before the market topped in 2021. Extreme outperformance by a limited number of companies can only lift the market so far.
If I am going to summarize the current macro scenario in broad strokes, I really struggle to come up with a happy scenario. Job growth has been dramatically overstated. The unemployment rate has been ticking up, and we are close to triggering the Sahm Recession Indicator, a highly respected indicator which identifies the onset of a recession.
It is named for Claudia Sahm, a former Fed employee who devised the rule, and it is particularly popular because it is both very simple and it triggers a very small number of false positive signals. It was first published by the St. Louis Fed as an indicator to help gauge more quickly when the Federal Government should step in with fiscal support to help offset the onset of a recession. The Sahm Recession Indicator signals the start of a recession when the three-month moving average of the national unemployment rate rises by one half of one percent relative to its low during the previous twelve months.
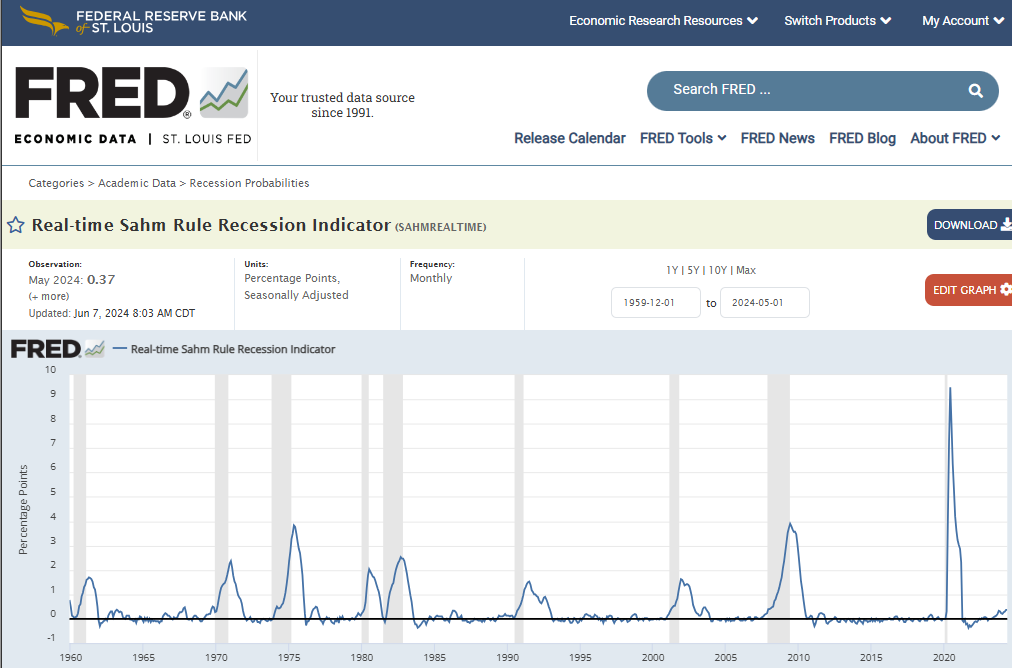
As you can see from this chart, the moving average is currently .37 percent above its prior twelve month low, so we are very close to moving into a recession according to the Sahm Rule. Of course, the perversity of this situation is that the Federal Government has already been spending like we were in a recession, so it is unclear what the government can and will do to help the economy recover from a slowdown.
Another trigger that I like to look at is the relationship between the unemployment rate and its 36-month moving average. For the first time in roughly four years, the US unemployment rate has crossed above its three-year moving average. In nearly every prior instance of this occurring, a sharp spike in the jobless rate followed. The unemployment rate has been steadily climbing since April of 2023, having risen from 3.4% to 4,0%, more than a 17% rise.
Does this mean the employment market is about to break? The risk is there, but it could still potentially be avoided. Still, it is getting harder and harder for the authorities to keep plugging every hole in the economy. With the federal deficit at terrifying levels and climbing, there is frankly some limit to what the people in Washington can really get done to forestall a severe economic slowdown. In a very sick, cynical way I suppose I should be impressed with the resourcefulness and ingenuity of the American people. It took us 234 years to reach $11 trillion dollars in debt. Now, in just 14 years, we have grown that number by almost $24 trillion to nearly reach $35 trillion in debt. In fact, in just the past five years we have grown the debt by $12 trillion. Wow! When America really puts its mind to a task, it is amazing what she can accomplish.
Of course, the Fed is chomping at the bit to cut rates, so even though they have mastered the art of driving forward at full speed while looking backwards through the rear window, they will almost certainly start cutting rates too slowly. Data dependency is sensible, to an extent, except that the data includes time lags which are sometimes quite sizable.
In a way, it is weird that Sahm’s idea to identify when a three-month moving average of the national unemployment rate rises by one half of one percent relative to its low during the previous twelve months is considered to be such a novel innovation. Working with moving averages and key data points is part of a tried-and-true trading methodology used by trend following traders for decades. In fact, I was shown many ways to use moving averages in my market analysis during my first job on Wall Street nearly forty years ago. How can it be that the Fed is only now using this methodology and identifying it as innovative? In any event, the point is that at some point the economy will go into recession again. I wouldn’t be at all surprised if it is much sooner than later. Economic cycles have been part of the human experience for thousands of years, so we should not imagine that these cycles will suddenly end. In almost every instance, once the Fed starts to cut rates to deal with a recession, the stock market goes down – a lot.
In prior economic cycles, once the Fed started to cut rates in response to a recession, the S&P500 has dropped on average more than 23% within the first seven months following the first interest rate reduction. The stock market might rally in anticipation of Fed rate cuts, but once the Fed starts cutting rates in response to a recession, the stock market will almost always behave very badly. Whether that happens before or after the election, look out below.
In terms of triggers, whether we move into a major risk-off scenario due to a recession, a resurgence in inflation, geopolitical aggression, domestic unrest, political turmoil, or anything else, the stock market is way overvalued. I think we have a 60% chance of one more strong rally, however, a de facto blow-off top, before we then start a debilitating, crushing sell-off that will leave very few prisoners. Possible targets for this sell-off are much, much lower. Don’t be surprised if we even approach levels not far from the post-Covid lows in 2020. The best stocks will outperform on a relative basis, but even companies like Nvidia will have enormous downside.
I am often early with my forecasts, and I really hope my thinking is wrong in this case, but please consider carefully what I have said in this week’s newsletter. Next week I will address the currency markets in some depth.
In the meanwhile, wishing you the best of luck with your trading.
Andy Krieger