SPECIAL REPORT (Sunday Afternoon March 8, 2026) THE HORMUZ SHOCK: MARKETS, MACRO, AND THE GEOPOLITICAL BREAKPOINT
Thoughts on the Market
Executive Summary -- March 8, 2026
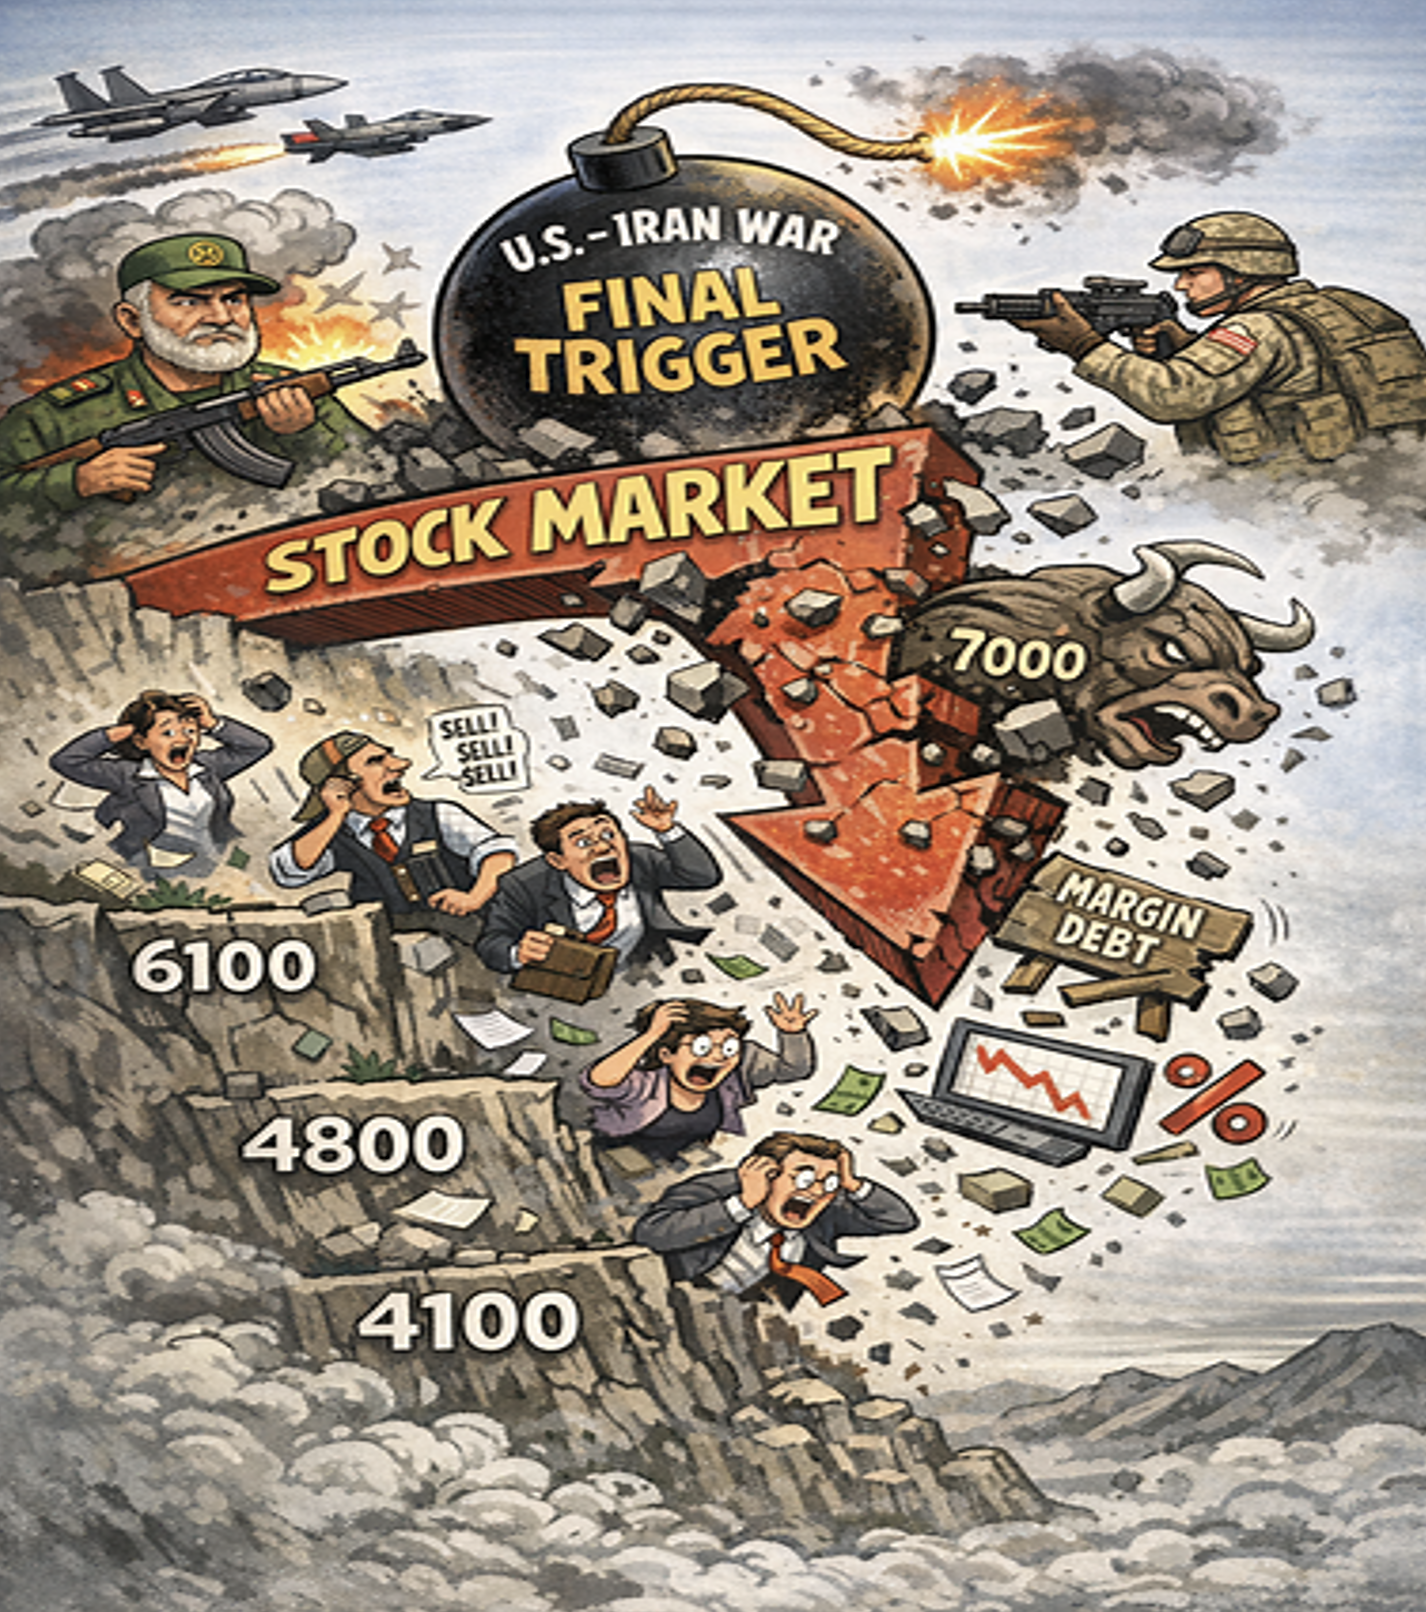
Global markets have entered a regime‑shift moment. The U.S. war with Iran has delivered the long‑anticipated trigger for a market downturn that I have written about for weeks. The rally was weak and overextended, and it looked highly vulnerable. In a recent newsletter, I warned my readers that “the only missing piece in the puzzle has been the trigger” -- and the recent decline of 3% fully confirms the failed breakout in the S&P500 above 7000.
What happens next hinges on whether dip‑buyers defend the 6600–6500 band — a zone that includes the 200‑day moving average at 6582, “Charlie Munger’s favorite entry point.” A failure here opens the path to a disorderly slide toward 6100–6000, amplified by record‑high margin leverage and forced deleveraging. Let’s see how the market opens in several hours. The close on Friday at 6830 looked sick, but we need to see some downside follow through this coming week.
But the equity story is only the surface. The deeper macro shock is the emerging Hormuz blockade, which threatens oil, LNG, fertilizers, sulfur, sulfuric acid, and semiconductor supply chains simultaneously. This is the architecture of a stagflationary global shock — and it traps the Federal Reserve in an impossible policy corner.
1. Market Structure: A Fragile Top Meets a Geopolitical Trigger
1.1 The failed breakout
The index’s rejection above 7000 confirms a classic exhaustion pattern. The next leg lower is decisive:
- A strong bid at 6600–6500 stabilizes the structure.
- A weak bid accelerates the decline toward 6100–6000.
1.2 Leverage as the accelerant
Margin debt is now three times more leveraged than at the Dot‑Com bubble peak. This is the most dangerous setup in 25 years. A break of 6500 would trigger:
- Systematic deleveraging
- Retail capitulation
- Institutional hedging
- Volatility‑targeting outflows
The result could be near‑panic trading conditions on the way to 6100.
2. The Iran War: A Protracted, High‑Intensity Conflict
2.1 The strategic reality
A clean victory is extremely unlikely. Moreover, a regime change in Iran is almost certainly not going to happen. The IRGC’s incentives — existential, ideological, and institutional — bias the conflict toward escalation and endurance. Frankly, any government that is willing to murder tens of thousands of their own citizens for protesting some of the government’s policies is willing to inflict absolutely horrific suffering on its people in order to retain their power.
2.2 Most plausible trajectory
The base case is a prolonged, region‑wide, high‑intensity conflict dominated by:
- Air and cyber strikes
- Missile and drone exchanges
- Proxy warfare across Lebanon, Syria, Iraq, and Yemen
- Maritime harassment
The recent destruction of desalination plants in Iran and subsequently in Bahrain introduces a horrifying humanitarian dimension that raises the stakes for every Gulf state. The gulf region is enormously dependent on its desalination facilities for drinking water, so the U.S. and Iran have both crossed a red line with these acts. The dangers in this war are intensifying.
3. The Hormuz Shock: The Global Economy’s Hidden Achilles Heel
3.1 Why Hormuz is uniquely dangerous
The Strait is only 21 miles wide at its narrowest point, and it carries:
- 20–30% of global crude
- 25–35% of global LNG
- 27% of maritime oil trade
Even a partial disruption reprices:
- Oil
- LNG
- Shipping insurance
- Aviation fuel
- Global freight
- Risk assets
3.2 The overlooked chokepoint: sulfur and sulfuric acid
A shutdown or even partial disruption of the Strait of Hormuz would choke global sulfur flows, severely constrain sulfuric acid supply, and directly threaten Taiwan’s semiconductor output. This is an underappreciated factor that seemingly hasn’t been factored into the equation by the U.S. authorities.
Why sulfur matters
- It is a byproduct of Gulf oil & gas
- It is the feedstock for sulfuric acid, the world’s most produced industrial chemical
- Sulfuric acid is essential for:
- Fertilizers
- Copper & cobalt processing
- Battery materials
- Semiconductor cleaning
A sulfur shock is simultaneously a fertilizer shock, a metals shock, and a semiconductor shock.
4. Taiwan’s Semiconductor Vulnerability
4.1 Why sulfuric acid is irreplaceable
Ultra‑pure sulfuric acid (UPSA) is used in:
- RCA cleaning
- Post‑etch cleaning
- Photoresist stripping
- Metal contamination removal
A shortage means:
- Lower yields
- Slower throughput
- Prioritization of high‑margin nodes
- Potential fab shutdowns
4.2 Taiwan’s mitigation — helpful but insufficient
Taiwan has built:
- SAR Technology’s full‑cycle UPSA regeneration plant
- A second MECS® regeneration facility
These reduce waste and improve resilience — but they still depend on sulfur feedstock.
4.3 LNG dependence
Plus the LNG supply is crucial to the powering of the major semiconductor plant facilities. A Hormuz LNG shock compounds the UPSA shock.
4.4 Timeline of semiconductor disruption
- 1–2 weeks: inventories tighten
- 1–2 months: rationing, yield loss, reduced output
- 3+ months: global chip shortages return
Memory (DRAM/NAND) and mature nodes are hit first; advanced nodes follow. It is the delays in the delivery of advanced chips that may evoke the greatest howls from corporate America – and there will be plenty of howls coming from many directions.
5. Food, Fertilizer, and the Two‑Stage Global Food Shock
Stage 1: logistics + energy → higher food prices
Stage 2: fertilizer shortages → lower yields → global grain & protein inflation
This is especially destabilizing for Emerging Market importers.
6. U.S. Macro: Weak Jobs + Energy Shock = Stagflation Risk
6.1 Growth
Higher energy costs act as a tax. With jobs already weakening, recession risk rises.
6.2 Inflation
Headline CPI re‑accelerates via:
- Gasoline
- Food
- Fertilizer
- Shipping
- Semiconductor bottlenecks
Expectations risk drifting higher.
7. U.S. Politics: Gas Prices as Political Dynamite
Gasoline is the most visible economic variable for voters. A Hormuz‑driven spike will be weaponized instantly.
Expect:
- SPR releases
- Pressure on domestic production
- Populist calls for price controls or windfall taxes
- Intensified polarization around economic competence
8. FX: The Most Complex Cross‑Asset Channel
The FX landscape in a Hormuz‑driven stagflation shock is radically asymmetric. The dollar’s path will not be linear. The first phase is reflexive: a flight into USD liquidity. The second phase — the one that matters most — is when markets recognize that the U.S. is not the safe haven in this crisis, but rather the epicenter of the stagflation shock.
When that recognition arrives, the dollar can fall sharply against currencies with:
- Strong external balances
- Commodity leverage
- Safe‑haven status
- Central banks forced into hawkish pivots
This is where CHF, JPY, and CAD become the most compelling anti‑USD expressions.
8.1 The Euro: A Structural Underperformer in This Regime
Europe is:
- A massive net energy importer
- Highly exposed to fertilizer and food inflation
- Dependent on global semiconductor supply chains
- Facing weaker growth momentum than the U.S.
If the U.S. dollar regains safe‑haven status — even temporarily — the euro will weaken significantly.
Result: EUR becomes the weakest major currency in the developed world. This sets-up powerful relative trades.
8.2 EUR/CHF: A One‑Way Safe‑Haven Valve
CHF strengthens as Europe absorbs the energy shock. EUR/CHF biased sharply lower, with potential for multi‑standard‑deviation moves.
8.3 EUR/CAD: A Terms‑of‑Trade Supercycle
Canada benefits from triple‑digit crude. Europe suffers from it.
EUR/CAD likely falls aggressively. My downside targets are much, much lower. I see it heading towards 1.45, with a potential drop as low as 1.30
8.4 EUR/AUD: China‑Sensitive, But Still EUR‑Negative
Even in risk‑off, AUD can outperform EUR due to Europe’s structural vulnerabilities. EUR/AUD downside is compelling. Initial target around 1.60, but it can go much lower over time.
8.5 EUR/USD: The Core Expression of Europe’s Vulnerability
If the dollar becomes a safe haven, EUR/USD can break sharply lower. ECB will be forced to ease while the Fed delays cuts → EUR/USD downside.
8.6 CAD, AUD, CHF vs USD
- CAD: Strongest G10 beneficiary of triple‑digit crude pricing
- AUD: Mixed, but can strengthen if U.S. capital rotates out of equities
- CHF: Classic safe haven; strongest vs EUR and EM FX
- JPY: Tail risk of a violent carry unwind
8.7 When the Dollar Breaks Lower After Its Initial Rise
Downside targets for USD/CHF, USD/JPY, and USD/CAD
The second phase of the crisis begins when markets conclude that:
- The U.S. dollar is not a safe haven,
- The Federal Reserve is trapped in a stagflationary box, and
- The BOJ must tighten far more aggressively than expected, triggering a panic unwind of yen carry trades.
This is where the most dramatic FX moves occur.
USD/CHF — The Pure Safe‑Haven Reversal
Once the dollar loses its safe‑haven premium, CHF becomes the only true refuge.
Downside Targets for USD/CHF:
- 0.73-75 — Base case
- 0.70–0.72 — Fed credibility shock
- 0.66-68 — Tail scenario (Treasury liquidation + stagflation)
Switzerland’s strong external position and the SNB’s tolerance for a stronger franc amplify the move.
USD/JPY — The Trapdoor: A Violent Carry‑Trade Unwind
This is the most asymmetric FX risk in the crisis.
The BOJ will be forced to tighten because:
- Imported inflation surges
- Yen weakness becomes politically intolerable
- Wage negotiations strengthen
- Japan’s energy bill explodes
- Global inflation spills into Japan
Once the BOJ pivots hawkish, the yen carry trade collapses.
Downside Targets for USD/JPY
- 138–143 — Base case unwind. Yes, the yen will absolutely surge if the carry trade collapse.
- 115-120 — Aggressive BOJ tightening triggers a violent surge in the yen
- 105–110 — Full carry‑trade capitulation (LTCM‑style dynamics)
USD/JPY is the “trapdoor” pair — when it breaks, it breaks fast.
USD/CAD — The Commodity‑Supercycle Repricing
Canada is the cleanest G10 beneficiary of:
- Triple‑digit crude prices
- LNG shortages
- Fertilizer shortages
- A global scramble for non‑Gulf energy supply
Meanwhile, the U.S. faces:
- Stagflation
- Fiscal stress
- Treasury liquidation risk
- A trapped Federal Reserve
Downside Targets for USD/CAD
- 1.23–1.25 — Base case
- 1.20–1.22 — Strong CAD scenario
- 1.15–1.18 — Tail scenario (Treasury panic + Fed forced cuts)
USD/CAD becomes the “quiet killer” of the dollar — a slow, relentless grind lower.
8.8 Why These Moves Can Happen Faster Than Expected
Three forces can converge:
1. Treasury Panic Selling
Investors may dump Treasuries if they conclude:
- The Fed cannot cut
- The Fed cannot hike
- Inflation is rising
- Growth is falling
- Fiscal deficits are exploding
This leads to a large-scale exodus and a buyer’s strike in the world’s largest bond market.
2. The Fed’s Stagflation Trap
- Weak jobs → Fed should cut
- Rising inflation → Fed cannot cut
- Treasury stress → Fed must avoid cuts
- Political pressure → Fed must avoid hikes
This is a policy paralysis that destroys the dollar’s credibility.
3. BOJ Tightening + Carry Unwind
The BOJ’s pivot is the detonator. Once they tighten:
- USD/JPY collapses
- Cross‑JPY carry trades implode
- Volatility spikes
- USD selling accelerates
This is how a regional war shock becomes a global FX shock.
8.9 Summary of Downside Targets
|
Pair |
Base Case |
Strong Move |
Tail Scenario |
|
USD/CHF |
0.73–0.75 |
0.70–0.72 |
0.66–0.68 |
|
USD/JPY |
138–143 |
115–120 |
105–110 |
|
USD/CAD |
1.23–1.25 |
1.20–1.22 |
1.15–1.18 |
These are not extreme forecasts. They are logical consequences of a world where:
- The U.S. is the epicenter of stagflation
- The Fed is trapped
- The BOJ tightens
- The dollar loses its safe‑haven premium
- Treasury markets wobble
- Commodity exporters thrive
- Safe‑haven currencies outperform
This is the second phase of the crisis — the one most investors are not prepared for.
9. Global Growth: A Downshift with EM Pain
Energy‑importing EMs face:
- Higher import bills
- Fertilizer shortages
- Food inflation
- Social instability risk
Global growth could lose 0.5–1.0 percentage points, with downside tails if the war widens.
10. S&P 500 Strategy: Systematic Downside Positioning
We have been actively accumulating shorter‑dated downside put spreads on the S&P 500, and we will continue to do so for the foreseeable future.
Why short‑dated put spreads?
- Volatility still underprices the true macro tail risk
- They capture air‑pocket risk — sudden, violent repricing
- They offer efficient convexity
- They monetize the path dependency of forced deleveraging
Downside Targets of S&P 500
If 6500 fails decisively:
- 6100–6000 becomes the first major destination
- A break of 6000 opens the path to retesting the April 2025 panic low at 4800
- If 4800 fails, the next structural target is 4100, which aligns with:
- Pre‑pandemic valuation bands
- Long‑term trend support
- Systematic deleveraging thresholds
Positioning Outlook
We will continue to:
- Buy short‑dated downside put spreads
- Stagger maturities
- Increase size on failed retests of resistance
- Reduce size only if the market reclaims 7000 with conviction
- Layer in a variety of currency plays using limited risk option strategies
This is not a one‑off hedge. It is a campaign — a structured, ongoing strategy aligned with the evolving risk landscape.
11. The Stagflation Trap: Why the Federal Reserve Is Cornered
The U.S. economy is now facing the most dangerous macro configuration since the early 1980s: weakening labor markets colliding with a powerful, externally driven inflation shock. The Federal Reserve is caught between its dual mandates in a way that leaves almost no room for maneuver.
11.1 The Labor Market Is Rolling Over
The latest jobs report was not a blip — it was a signal. As noted earlier, “the weak job numbers last week were alarming.” Under normal circumstances, this would push the Fed toward rate cuts. But these are not normal circumstances.
11.2 The Inflation Shock Arrives at the Worst Possible Time
The Hormuz disruption delivers a multi‑channel inflation surge:
- Energy
- Food
- Fertilizer
- Shipping
- Semiconductor bottlenecks
Headline CPI will re‑accelerate. Expectations will drift higher. Real incomes will be squeezed.
11.3 The Fed’s Impossible Choice
The Fed cannot:
- Cut rates (inflation risk, credibility loss)
- Raise rates (recession risk, financial instability)
- Stay neutral (market forces tighten conditions anyway)
This is the definition of a stagflationary trap.
11.4 The Fed’s Likely Reaction Function
- Near term: No rush to cut
- Medium term: Fewer and later cuts
- Long term: Cuts only if labor deteriorates sharply
11.5 Why This Matters for Markets
This is the most dangerous macro environment for risk assets:
- Growth weakening
- Inflation rising
- Fed constrained
- Fiscal policy paralyzed
- Energy and food shocks global
This is the exact configuration that historically produces:
- Equity multiple compression
- Bond‑equity correlation breakdowns
- FX volatility spikes
- Commodity super‑spikes
11.6 Summary
PUT ON YOUR CRASH HELMETS
The Federal Reserve is trapped: weak jobs demand easing, surging inflation forbids the rate cuts — and this is the purest definition of stagflation.
These are extremely challenging markets. I wish you the best of luck navigating them. Hopefully this write-up helps you make sense of an increasingly complex, messy scenario.
Andy Krieger