THE MOST GLARING DISCONNECT IN MARKETS RIGHT NOW
Thoughts on the Market
By Andy Krieger May 24, 2026
Two of the Smartest People in Finance Are Warning You. The Market Doesn’t Care
Part I: The Bear Case — What Hartnett Is Saying
Michael Hartnett, Chief Investment Strategist at Bank of America, has issued his most severe bubble warning in his career. He is not calling this the dot-com bubble. He is not calling this the Japanese bubble of the 1980s. He is saying this
is the biggest bubble since the railroad mania of the 1880s, when railroad stocks accounted for 63% of the entire U.S. stock market. Today, AI-related assets are approaching 48% concentration in U.S. equities, and once the pending mega-IPOs are included, that figure would exceed every bubble peak in the past century except the railroads.
Hartnett has earned the right to be taken seriously on this. A year ago, when analysts were calling AI an obvious superbubble, he disagreed; he called it a “mini bubble” and said it wasn’t the big one yet. He was right. Those who sold then missed one of the great bull market runs in history. Now his view has shifted markedly.
His Bull & Bear Indicator has hit 8.0, triggering a formal contrarian sell signal — the 17th such signal since 2002. When this signal has fired before, global stocks have averaged losses of 2–3% over the following two to three months. Frankly, 2-3% doesn’t sound very menacing, but we will address this later. But Hartnett is not telling you to sell yet. He is telling you to wait for two specific things:
Trigger One: The Historic IPOs
SpaceX and OpenAI are preparing what would be the largest initial public offerings in history. Hartnett argues that no one cuts their long equity positions before these events, because the euphoria around them is the final fuel of the melt-up. Historically, when the last great IPOs hit the market, it is the signal that the party is ending. This was true in 1929. This was true in 1999. This was even true in 1873, with the railroads.
Trigger Two: CPI Hitting 4–5%, Forcing Policy Tightening
Hartnett believes inflation will reaccelerate in coming months, forcing the Fed’s hand. The 30-year Treasury yield has already hit a 19-year high. The pin that pops every bubble on record is when the central bank is compelled to tighten into an overheated, over-leveraged market. Hartnett’s summary of the current market mood: “Strong price action, retail mania, slumping vol… so bubbly.”

As you can see from the table, my analysis of Hartnett’s calls is compelling as an early warning signal, and it is compelling in terms of risk-reward, but it is early in terms of predicting major declines. Of course, we haven’t had very many major declines since 2002.
Part II: The Bear Case — What Dimon Is Saying
Jamie Dimon is not a strategist. He is the CEO of the largest bank in America, with direct visibility into the actual plumbing of the global financial system. His warnings come not from models but from loan books, client balance sheets, and two decades of watching crises develop in real time.
In a recent interview, Dimon presented some very sobering statistics. There are approximately $5–6 trillion in leveraged loans outstanding to companies that are going to have a very hard time refinancing at current rates. He maintains that the equity values of those companies should be a fraction of their current market valuations. Many of them did not hedge for higher rates. Dimon said plainly that he personally would not buy corporate credit spreads at current prices – in other words, the CEO of the largest bank in America, on camera, telling you he thinks corporate debt is mispriced.
Dimon then described exactly how sentiment collapses: everyone is confident, everyone is buying, liquidity appears everywhere. Then something shifts. People want cash. And when people want cash, they sell risky assets at precisely the wrong moment. Liquidity disappears at the exact moment everyone needs it. He named the crashes of 1973, 1982, 1994, and 2000 and said today’s conditions look exactly like the setup before each crash.
Dimon also invoked the “cockroach” principle of credit events — where one default implies many more — noting that companies like Saks, New Fortress Energy, and Tricolor Holdings have already collapsed, and the first half of 2025 saw a record number of mega-bankruptcies, with large-company filings running 81% above the long-term average.
Why this matters for equities broadly:
The $5–6 trillion in leveraged loans isn't held by public companies alone – much of it sits in private equity-owned businesses. But those PE firms have limited partners, and when portfolio companies are revalued downward, the LPs – which include pension funds, endowments, sovereign wealth funds, and insurance companies – face write-downs that force them to rebalance. That rebalancing means selling liquid assets, which means selling public equities. This is the transmission mechanism from private credit stress to public market selloff, and it's exactly the liquidity-disappears-when-everyone-needs-it dynamic Dimon is warning about.
Part III: The Data Supporting Both of Them
These are not abstract concerns. The numbers are already printing:
• The 30-year Treasury yield recently hit 5.2%, its highest level since 2007. The 10-year sits at 4.56%.
• The U.S. government carries $31 trillion in public debt at an average interest rate of 3.5% -- it cannot refinance a single dollar at a lower rate than it is currently paying, and it has $9.7 trillion in securities maturing this year.
• Inflation reaccelerated in April to its highest annual rate in three years. The Iran war has pushed oil to four-year highs.
• Markets are pricing zero rate cuts for the rest of 2026. The probability of a rate hike is rising.
• Private credit defaults just hit a record 9.2% default rate in U.S. private credit portfolios.
• Bond yields are simultaneously at historic highs in the U.S., U.K., Germany, and Japan — the last time this occurred simultaneously was the months before the 2008 financial crisis.
Hartnett and Dimon reached these conclusions independently, through entirely different analytical frameworks -- one a top-down macro strategist, the other a bottom-up banker with access to actual balance sheets. They are not coordinating. They are not echoing each other. They are arriving at the same place from opposite directions.
Part IV: The Market’s Response — New All-Time Highs
The S&P 500 is sitting at 7,500. Fund managers just increased their equity allocations by the most on record in a single month. Cash levels have fallen to 3.9%. The AI boom is producing real earnings -- 84% of S&P 500 companies beat their first-quarter profit estimates. Goldman Sachs is forecasting 12% EPS growth this year, with AI investment driving roughly 40% of that growth. The largest cloud companies plan to spend an estimated $670 billion on AI infrastructure in 2026 alone.
And yet the structural rot is hiding in plain sight. The wealth disparity in America -- and across the developed world — has worsened dramatically. The top 10% of Americans account for 50% of all consumption. The average consumer is being crushed by inflation that has proven far stickier than the Fed anticipated. Real wages for the bottom half of earners are under pressure. The people buying stocks and the people struggling to afford groceries are, increasingly, not the same people.
This raises a question the market has not yet been forced to answer: are stocks a good hedge against inflation when the inflation is destroying the consumer base that underlies corporate earnings? Historically, equities have outpaced inflation over long periods. But that relationship breaks down when inflation is driven by supply shocks and energy costs rather than demand growth -- precisely the kind of inflation the Iran war has produced.
The market does not care about this yet. Markets that rally on bad news are dangerous markets to short. But they are not markets to trust.
Part V: The Iran Variable -- The Most Underappreciated Catalyst
The Iran war has distorted nearly every macro variable in this analysis, and its resolution -- when it comes -- will be one of the most significant market catalysts in years. The Strait of Hormuz closure has been devastating on multiple levels: oil at four-year highs, supply chain disruptions, defense spending crowding out productive investment, and a remilitarization premium baked into energy prices globally.
Trump is under enormous pressure to end this war. He has been trying to downplay its economic impact, but the numbers do not cooperate. His challenge is political as much as military: he needs to make the end of the war look like a victory. The U.S. has depleted significant and expensive missile and weapons inventories. Iran has not surrendered its enriched nuclear material. A ceasefire that ends the Strait closure while leaving the underlying nuclear question unresolved is the most likely outcome — and it will be sold as a triumph regardless of its obvious shortcomings.
The nuclear material and the weapons stockpile questions are, for markets, noise. What matters is oil. An extended ceasefire and the reopening of the Strait of Hormuz will send oil prices sharply lower, which would be unambiguously positive for equities, for inflation, for the Fed’s calculus, and for the consumer. It would also hand the market a powerful narrative -- a geopolitical win, falling oil, receding inflation pressure -- at a time when investors are already at maximum bullishness.
This is the near-term bull case that overwhelms the structural bear case. And it is a real one. The uptrend is still in force, and that matters.
Part VI: The Bull Case -- Why They Might Be Right to Keep Buying
AI Is Producing Real Earnings, Not Just Promises
Unlike the dot-com era, the AI cycle is already generating extraordinary returns. Goldman Sachs projects AI-driven productivity gains will support 12–15% earnings growth for two consecutive years. This is not speculation: it is already in the quarterly reports.
Nearly Every Warning Has Been Wrong for Three Years
The people who listened to early bubble warnings missed 25% gains in 2024 and 17% in 2025. Being early in calling a top is economically indistinguishable from being wrong. The market has punished caution consistently.
Yes, I was able to identify a short-term top right before the Iran war, but that was a strategic call and not a structural one.
Capital Has Nowhere Else to Go
With bonds yielding 4–5%, the risk-free alternative is more competitive than in 20 years but it still cannot match the earnings growth trajectory of leading AI companies. For institutional allocators managing trillions, equities remain the only asset class with the capacity to meet their return obligations.
The IPOs Haven’t Happened Yet
By Hartnett’s own framework, the bubble has not peaked. The melt-up that precedes a historic IPO can be violent and fast. Selling now means missing the final and potentially most explosive phase of the rally.
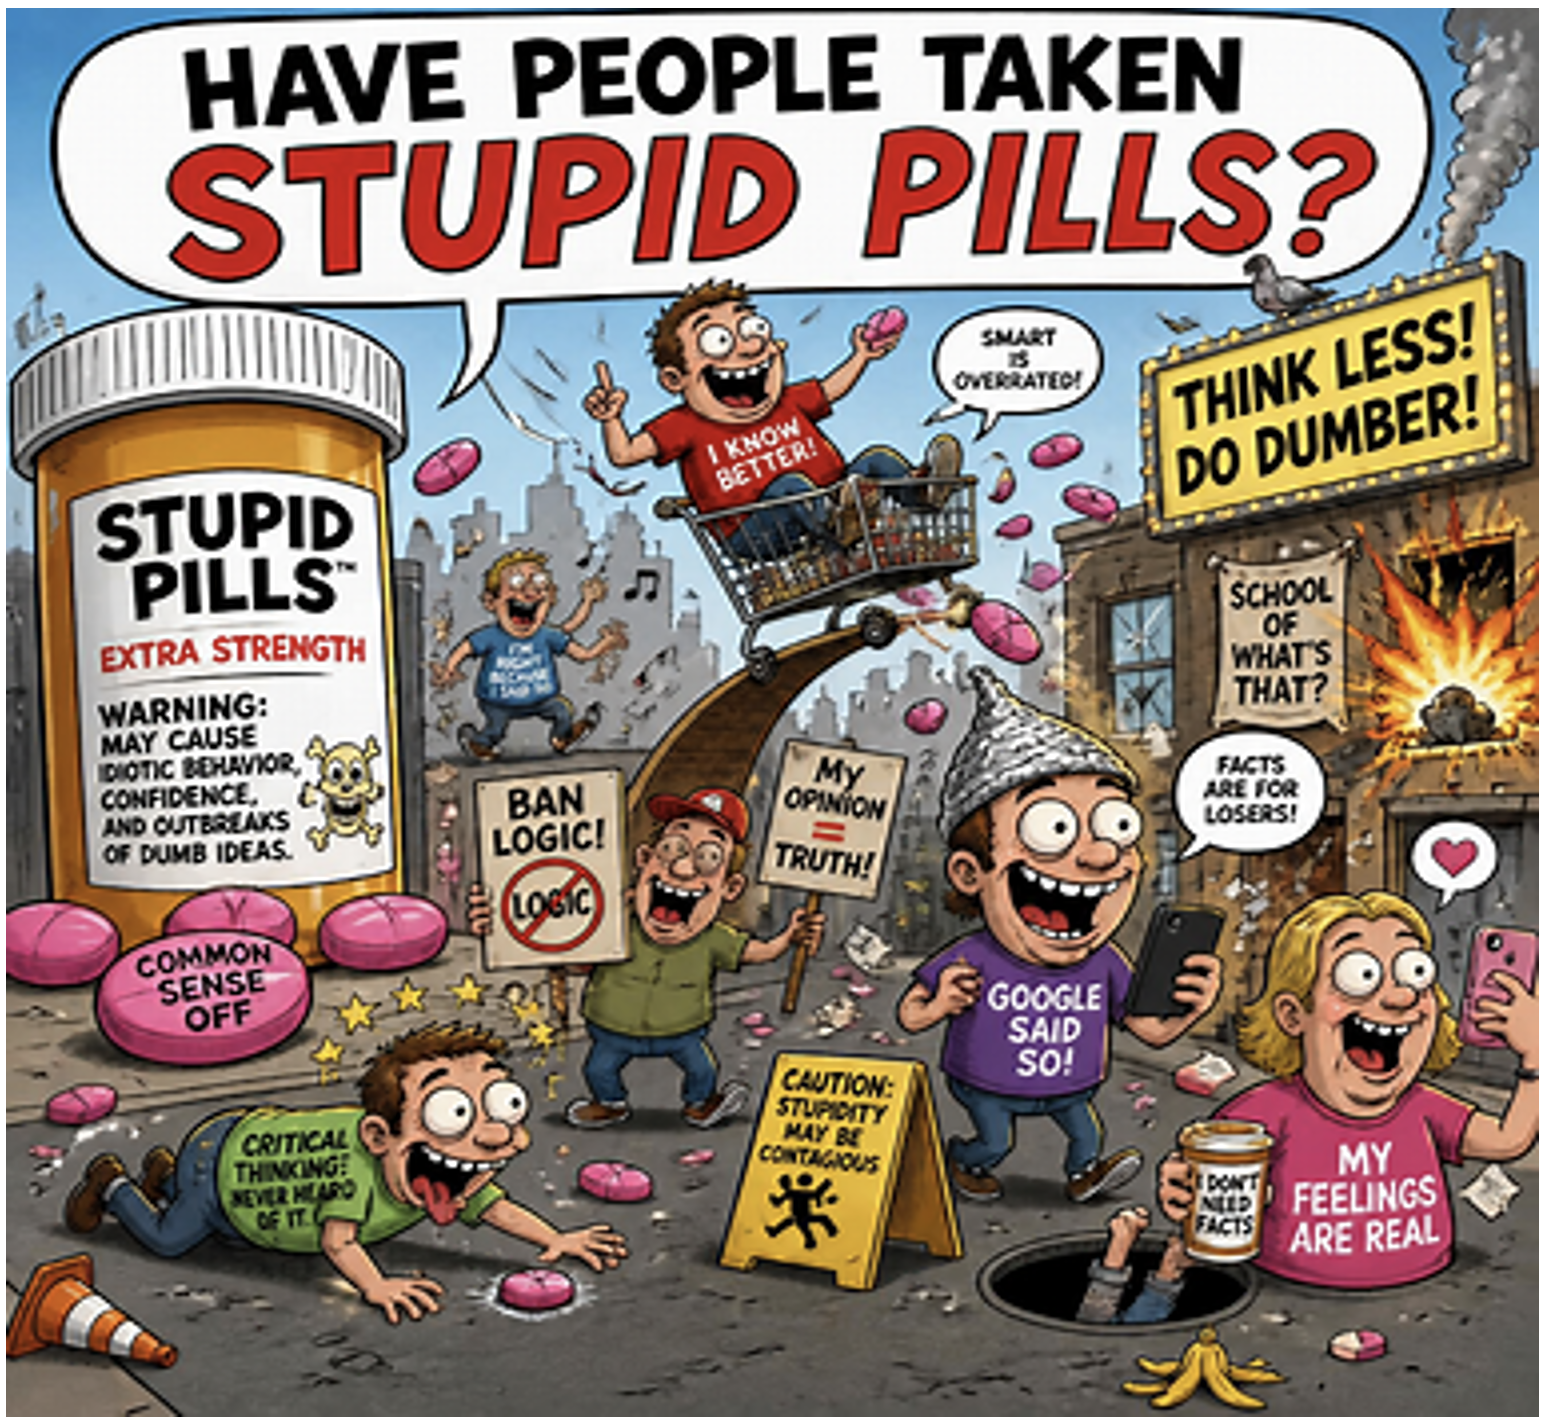
Part VII: So Have People Taken Stupid Pills?
No. And yes.
Markets can be simultaneously rational at the individual level and deeply irrational at the aggregate level. Each investor buying stocks today can point to legitimate reasons — strong earnings, AI productivity, no recession signal yet, the IPO pipeline, four consecutive years of gains. These are not crazy reasons. They are exactly the reasons bubbles persist long after the warnings begin.
What makes this moment genuinely dangerous is that the usual defense — “the fundamentals support it” — is partly true and partly borrowed time. The earnings are real. The AI productivity is real. But $5–6 trillion in leveraged loans that cannot refinance is also real. A $9.7 trillion government refinancing wall at 19-year-high rates is also real. A 9.2% private credit default rate is also real. And an economy where 10% of the population accounts for 50% of consumption is one that is more fragile than the aggregate numbers suggest.
The stock market is pricing in hope and dreams of future wealth and prosperity. That is not always wrong — markets are forward-looking by design. But when the forward-looking optimism is concentrated in the hands of a shrinking share of the population, financed by leverage that cannot be refinanced, in an environment of reaccelerating inflation and historic yield levels, the margin for error is essentially zero.
The disconnect between the warnings and the market is not a puzzle. It is the bubble itself. The recent compression in market volatility is part of the market’s warning that we need to be extra careful.
Conclusions
Six conclusions follow from this analysis:
1. This is late cycle, not end cycle — yet. Hartnett’s own framework says hold until the SpaceX and OpenAI IPOs complete. Until they do, the most likely near-term path is higher. The final phase of a bubble historically produces the fastest gains, and an Iran ceasefire catalyst could accelerate that move significantly.
2. A ceasefire in Iran would be the most important near-term market event. An extended ceasefire and the reopening of the Strait of Hormuz would send oil sharply lower, relieve inflation pressure, and hand the bull market a powerful narrative at a time of maximum bullishness. Expect the market to rally hard on this news. That rally is likely the final leg.
3. Watch how the market reacts to good news. The most reliable bearish signal is not a bad macro print, it is good news that the market fails to rally on. When the Strait reopens, when oil falls, when ceasefire is declared — and the market shrugs or sells off — that is the signal. A market that cannot advance on objectively good news is telling you something that no analyst can.
4. Don’t fight the tape, but don’t trust it. The uptrend is in force. Stepping in front of a moving train is not a strategy. The correct posture is to reduce long exposure gradually as the market climbs, not to take an aggressive short position. Lighten up into strength. The time to be fully hedged is not now, it is after the good-news-fails-to-rally signal appears.
5. The leveraged loan wall is one critical mechanism to watch. Not a vague valuation worry — a concrete $5–6 trillion balance sheet problem crowding into 2026–2027. Watch private credit default rates, credit spreads, and payment-in-kind activity as the leading indicators of systemic stress.
6. The best bull case in 2026 creates the worst setup for 2027. If the melt-up continues through the IPOs, if a ceasefire delivers a relief rally, if inflation stabilizes just below the trigger — the bubble grows larger. A bigger bubble means a more severe eventual correction. The very factors that could push the S&P to 8,000 this year are the ones that could send it to 4,000 over the following eighteen months.
My Experience In Trend Following
I have always divided my trading into separate buckets. I have had a “volatility bucket,” a “trend following bucket,” and my “counter-trend bucket.”
My volatility bucket is where I place my option strategies when I think that a compression in market volatility will be followed by a period of extreme market volatility – or vice versa. This sort of trading is probability driven and it has been a consistent money maker over time. Markets tend to move and gyrate at certain levels of volatility over time, and wild deviations from those long-term averages present excellent money-making opportunities. My own bias is to wait for extreme market compression and then put on a variety of long option plays to earn profits when the market starts to move more normally. In most cases, after extreme compression we tend to get extreme volatility, which is how we end up with the standard average level of volatility in the market. The recent market compression is noteworthy, but not quite sufficient yet for me to want to load up on long volatility plays
My trend following strategies adhere to a basic principle which has been profitable for many decades: once a trend is in force, it tends to continue for longer periods of time and for greater extensions of price than we might statistically expect. This has to do with the nature of market participants who tend to get positioned and participate in the trends at different stages of the move. For example, value investors might participate first, then trend following firms might jump on board once the trend is statistically confirmed by various metrics (moving averages, etc.), and finally, the retail sector tends to participate towards the end of the move when it is most extended. I know that following trends is a powerful source of profits since I have made lots of money riding them. Therefore, we need to be particularly careful when we try to anticipate the end of a major trend and the reversal of a longstanding bull market.
My counter-trend strategies are the smallest part of my portfolio in terms of total risk allocation because it is effectively stepping in front of a moving train. I always prefer to use option strategies when I am forecasting a major reversal as markets in motion tend to behave quite irrationally – as do investors when there is a type of mania. We have seen this replay over and over again in stocks, bonds, commodities, and currencies. In the current situation, I can’t emphasize enough how carefully we need to play for a major top and bursting of the equity bubble.
We are certainly in bubble-like conditions right now, but that doesn’t mean we can’t be long, and it doesn’t mean we have to play for a reversal right now.
A Final Word on Positioning
For some of my clients – and in particular for those who believe that we are close to a major top that will be followed by a decline of historic proportions -- I have shared a proprietary option structure that enables the clients to generate profits that grow exponentially as the market declines. This structure can be used as an effective hedging strategy or as a speculative tool. The positive payoffs increase as the market descends, but the strategy does not require you to call the top. It does not require you to fight the tape. It simply ensures that if Hartnett and Dimon are right about the destination — even if wrong about the timing — the cost of being hedged is trivially small relative to the protection provided.
My advice going forward given the growing disconnect between various aspects of the macro scenario is that it is fine to ride this bull market further, but we should reduce exposure gradually into strength. We should also look to structure some downside protection in case the bubble bursts and starts a major reversal. My strongest advice is to watch for the good-news-fails-to-rally signal. This is the signal that I have found most reliable over four decades of trading. Once you establish the downside protection, you can sleep at night knowing the downside tail risk is covered.
As always, I wish you the best of luck in your trading.
Andy Krieger
Sources: BofA Flow Show (Hartnett, May 2026); JPMorgan Annual Letter to Shareholders (Dimon, April 2026); Bloomberg Television interview; Goldman Sachs U.S. Equity Outlook 2026; Fidelity Market Outlook May 2026; Atlanta Fed GDPNow.
–––––––––––––––––––––––––––––––––––––––––––––––––––––––––
From Imre Gams:
My Framework
I treat markets as auctions, not prediction machines.
Most sessions on a day-to-day basis are balanced.
Edges form at the extremes of value.
I trade acceptance and rejection at those edges.
If value migrates, I align with it.
If it fails, I trade the rotation.
I am not in the business of forecasting.
I am in the business of validating participation.
_________________________________________________________
This week delivered a market of two halves.
The first half saw the market trade down to the very bottom edge of the key support zone at 7360 to 7427. Buyers stepped up exactly when they had to. The response was sharp and decisive — price powered back out of the zone and ran to within striking distance of the upper target zone of 7533 to 7542 by the end of the week.
The support zone did its job. Again.
Heading into next week, the same parameters apply. Above 7360 to 7427, buyers remain in control and the three upside targets stay in play — 7533 to 7542, then 7575 to 7585, and finally 7629 to 7639.
A failure to hold the support zone puts the downside targets back on the table — first 7278 to 7300, then 7184 to 7209.
Buyers have proven they want this zone. The market keeps telling you the same thing — listen to it.
Sellers stayed in control all week. Gold never reclaimed the 4611 to 4661 zone. Sellers kept the pressure on and the market moved lower as a result.
The parameters shift down accordingly.
The new control zone is 4536 to 4586. Above it, buyers get a shot at the upside target zone of 4722 to 4785. Below it, the two downside targets remain in play — 4411 first, then 4259.
Two weeks in sellers' hands. The burden is on buyers to take it back.
$102.52 was the level last week. Sellers defended it viciously and drove price straight into the cited downside target zone of $94 to $97.
Heading into this week, that target zone becomes the control zone. This is where the week gets decided.
If buyers can hold their ground inside $94 to $97, $102.52 becomes the first upside objective. Above there, the next target zones come in at $104.85 to $107.30, then $110 to $112.
If sellers hold the upper hand, the downside targets remain unchanged — $86 to $88 first, then $80.
Watch how the auction develops inside $94 to $97. Buyers need to show up here.