The Mystery of the S&P500 Resilience – Will It Persist?
Thoughts on the Market
April 6, 2026
Scenarios, Global Consequences, and a Darker Strategic Calculus
I. Positioning & Market Context
Last week I wrote about taking some profits on my short stock market positions, as I was sure we were due for a period of corrective consolidation. The market responded on cue with a strong bounce that tested the recent downtrend resistance line. The bounce looks corrective so far, so I have started rebuilding fresh downside limited-risk option plays in anticipation of renewed selling pressure.
My bearishness on stocks is not specifically linked to the Iran war as a cause. Rather, I view the war merely as a trigger. The bubble conditions that have built up in stocks should have led to a major reversal years ago, but the interventionist efforts of the authorities — through massive debt issuances and monetary stimulation — have been able to forestall the eventual cleansing. In doing so, however, they have magnified the scale of the eventual correction far beyond what most people can imagine.
The Debt Spiral
To understand why I believe the coming correction will be catastrophic, consider the trajectory of U.S. net interest payments on the federal debt. In 2007, this figure stood at $163 billion. It took thirteen years to double. Now look at the pace of the last six years:
|
Year |
Net Interest Payment |
Year-over-Year Change |
|
2020 |
$345 billion |
— |
|
2021 |
$352 billion |
+$7B (+2%) |
|
2022 |
$475 billion |
+$123B (+35%) |
|
2023 |
$659 billion |
+$184B (+39%) |
|
2024 |
$882 billion |
+$223B (+34%) |
|
2025 |
$970 billion |
+$88B (+10%) |
|
2026
(proj.) |
>$1,000 billion |
Exceeds $1 Trillion |
These numbers are terrifying — and they are only going to get worse. We are now facing an environment with sharply rising inflation and slowing growth simultaneously, driven by the largest energy shock the world has ever seen.
II. The Hormuz Crisis: Not an Oil Shock — A Molecule Shock
The magnitude of the global energy crisis now unfolding is genuinely unprecedented. The de facto closure of the Strait of Hormuz will have long-term deleterious effects on nearly every aspect of the global economy if it extends much longer. Energy is the key component of essentially every business — but the crisis extends far beyond crude oil, LNG, jet fuel, and naphtha.
The Hormuz blockade is not just an oil shock. It is much more. Oil, gas, urea, ammonia, phosphate, sulfur, helium — all trapped behind 21 miles of water. All feeding the three things modern life runs on: our fuel, our food, and our computers.
"The greatest threat to global energy security in history." — IEA Executive Director
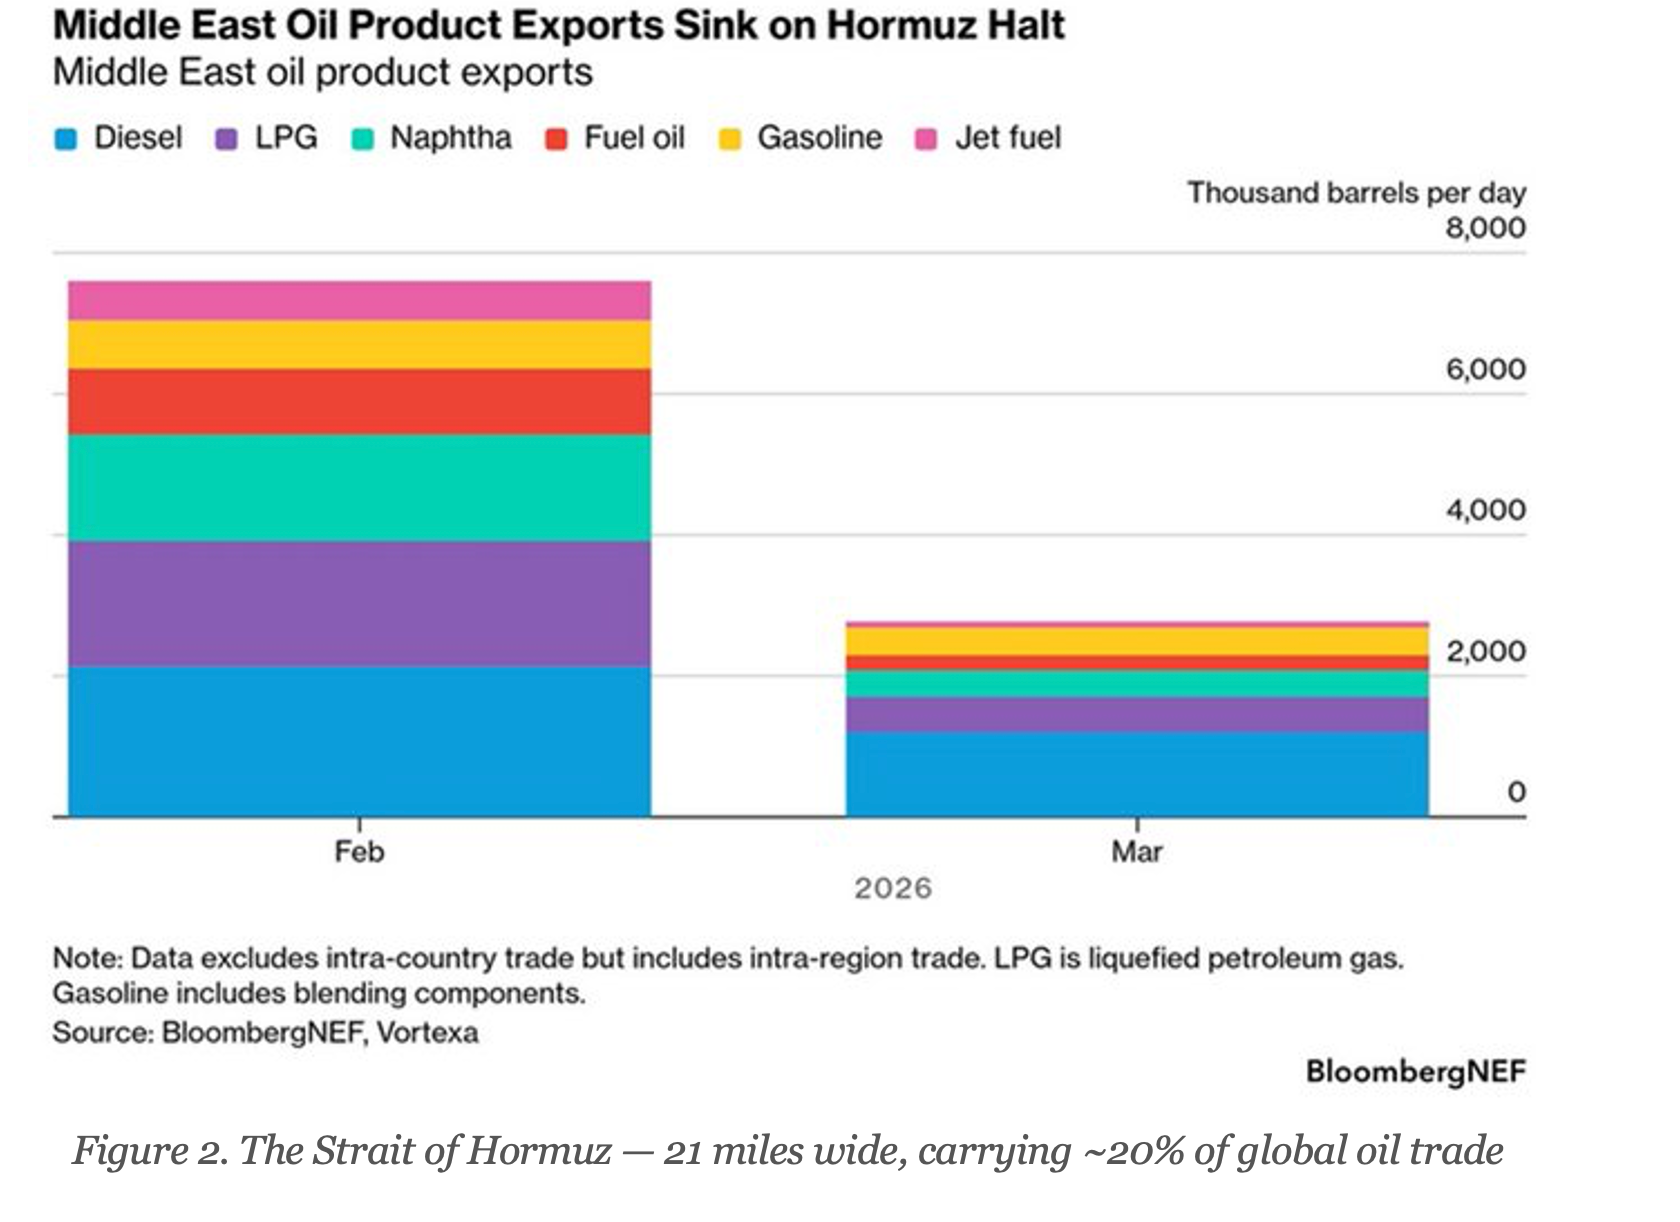
Crude and oil product flows through the Strait of Hormuz have plunged from around 20 million barrels per day before the war to essentially a trickle. Gulf countries have been forced to cut total oil production by at least 10 million barrels per day because, with storage tanks filling up and no ships able to leave, there is simply nowhere for the oil to go.
March data confirms the scale: Crude exports fell ~60%–70% depending on the dataset, product exports fell even more sharply— the largest recorded drop in history. For perspective, the entire 1973 Arab oil embargo cut roughly 4.4 million bpd. This crisis is already worse by volume. And unlike 1973, there is limited spare capacity sitting in Texas and elsewhere.
The Full Commodity Picture
The table below summarizes what is actually trapped behind the Strait. This is not simply an oil problem:
|
Commodity |
Gulf Share
of Global Trade |
Primary
Impact |
|
Crude Oil
& Products |
~20M bpd
(pre-war) |
–63% drop in
one month depending on the dataset |
|
Fertilizer
(Urea) |
46% of global
seaborne |
Food price
inflation; India, Brazil, China exposed initially |
|
Ammonia |
~20% of
seaborne exports |
Fertilizer
shortages; agricultural disruption |
|
Sulfur |
~50% of
seaborne trade |
Semiconductor
& EV battery supply chains |
|
Methanol |
~33% of
seaborne trade |
Chemicals,
plastics, paints (China most exposed) |
|
Helium |
~33% (Qatar) |
MRI machines,
semiconductor fabrication |
|
Aluminum |
~9% of global
primary |
Construction,
transport, renewables |
|
Mono Ethylene
Glycol |
6.5M tons/yr |
Textiles,
packaging, polyester fibers |
|
Iron Ore /
DRI |
Significant
premium supply |
Global
steelmaking disruption |
|
Jet Fuel |
–85% export
collapse |
Flight
cancellations across Asia-Pacific |
|
LNG |
Qatar: ~33%
global supply |
Power
generation; heating; chemical feedstocks |
Commodity-by-Commodity Impact
1. Fertilizers (Urea & Ammonia)
The Arabian Gulf is the central hub for global agriculture, accounting for at least 20% of all seaborne fertilizer exports. The dependency is most acute for urea — the world's most widely used nitrogen fertilizer — with 46% of global trade originating from the region. This supply is critical for major agricultural economies including India (18%), Brazil (10%), and China (8%). A prolonged disruption will significantly tighten availability in import-dependent regions, driving global food production costs — and inflationary pressures — sharply higher.
2. Sulfur
Sulfur — a critical energy material and primary byproduct of the region's oil and gas refining process — is currently at a standstill. Nearly half of all global seaborne sulfur trade passes through the Strait, making the Gulf the global price setter for the commodity. Sulfur is the feedstock for sulfuric acid, which is required for two critical global workflows: semiconductor fabrication (cleaning and etching silicon wafers) and the high-pressure acid leaching (HPAL) process required to refine nickel, cobalt, and copper for EV batteries and renewable-energy storage. Sulfur is also a primary reagent in producing high-analysis phosphate fertilizers.
3. Methanol
Around one-third of global seaborne methanol trade passes through the Strait — a key chemical feedstock for resins, coatings, and plastics. The situation is particularly significant for China, the world's largest methanol buyer, where port inventories could fall from comfortable levels to below warning thresholds if Middle East exports remain curtailed.
4. Helium
Qatar accounts for nearly one-third of the world's helium supply, produced as a byproduct of natural gas processing. The effects are already rippling through global technology supply chains. Helium plays a critical role in semiconductor manufacturing — from ultra-low-temperature cooling to highly precise fabrication. The greater concern, however, lies in healthcare: MRI scanners rely on liquid helium to keep their superconducting magnets at extremely low temperatures. Without a stable supply, MRI machines cannot operate.
5. Aluminum
The Middle East is a major global supplier of primary aluminum outside China, producing around 9% of global primary supply. Supply from Gulf smelters has been constrained, and over 150,000 tons of metal registered on the London Metal Exchange have been pulled from warehouses, reflecting the wider disruption to regional exports.
6. Mono Ethylene Glycol (MEG) & Graphite Feedstocks
MEG — a key input for polyester fibers, packaging, and textiles — is one of the Gulf's most significant chemical exports, with around 6.5 million tons shipped in 2025 alone. Synthetic graphite for EV battery anodes relies on petroleum coke, a byproduct of oil refining, as its primary feedstock. With oil refineries focusing on higher-value outputs while prices rally, availability of petroleum coke will tighten, squeezing EV battery costs already under pressure from nickel, cobalt, and sulfur disruptions.
III. Real-World Consequences Already Unfolding
This is not a theoretical exercise. The knock-on effects are hitting ordinary people now:
■ The Philippines has declared a national energy emergency.
■ Sri Lanka has introduced a four-day working week to conserve fuel.
■ Hotels and restaurants in Mumbai have shut down due to a shortage of cooking gas.
■ Jet fuel supply is down 85% from the region — flights across Asia-Pacific are being canceled.
■ Industrial slowdowns are already being reported in Indonesia and the copper belt of Africa.
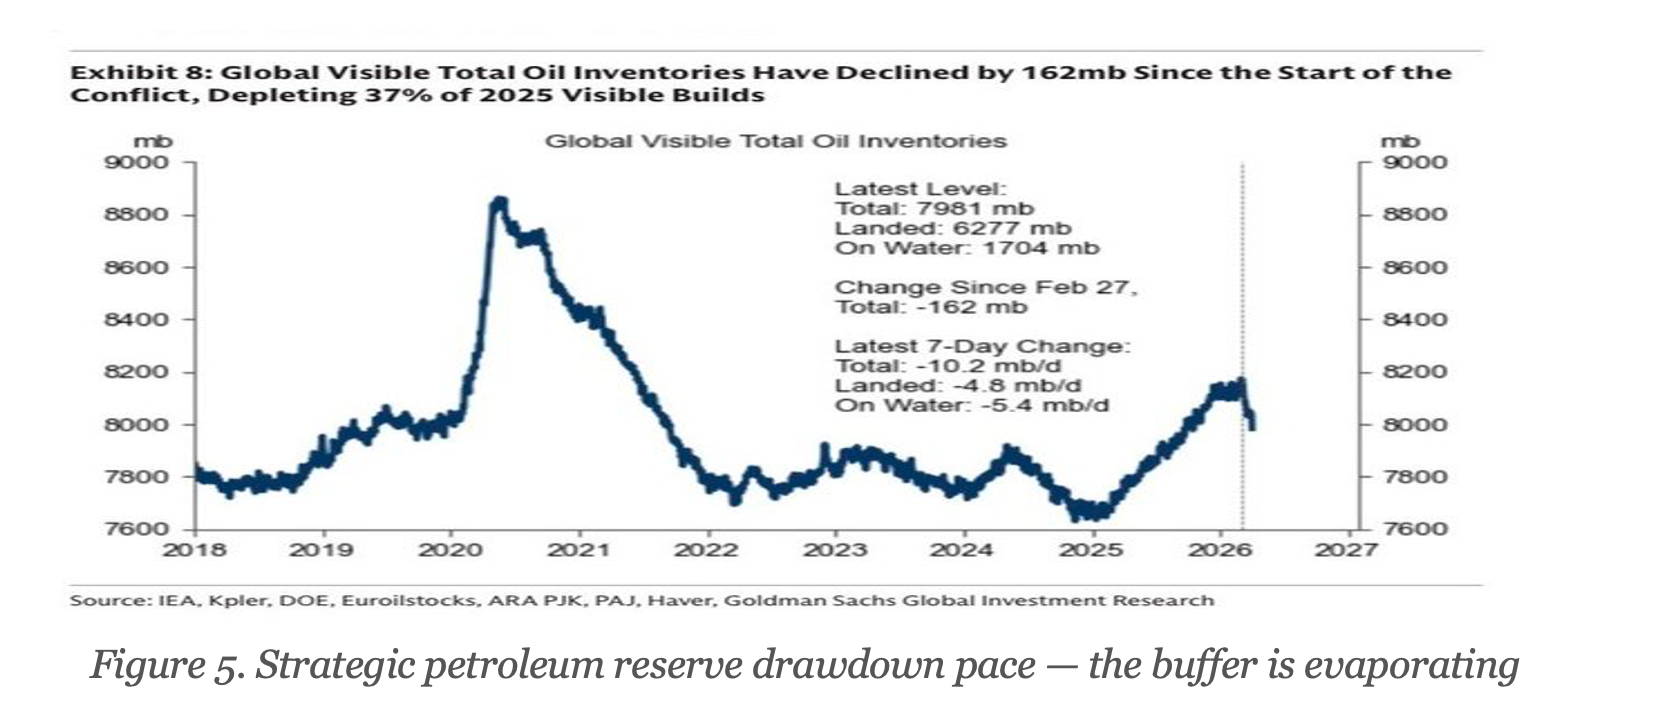
■ 162 million barrels drawn down since February 27 — at 10 million barrels per day. And both sides have now begun bombing each other's petrochemical infrastructure. The buffer isn't thinning. It is evaporating — while the ability to refill it is being destroyed.
European refiners are among the most exposed. After redirecting away from Russian crude, they had grown reliant on Middle East refined products. A –63% drop layered on top of tariff-driven demand destruction creates simultaneous supply and demand shocks — the worst possible combination for price stability.
Asset Market Correlations
Over the last 30 days, oil has shown a strongly negative correlation with nearly every major asset class:
■ Global bonds: –0.67
■ Developed market stocks: –0.55
■ Emerging market stocks: –0.41
■ Bitcoin: –0.28
■ Gold: –0.15 (failing as a safe haven in this particular crisis)
■ U.S. Dollar: +0.45 (surging energy costs fuel Dollar demand globally)
Until oil prices stabilize, volatility across every asset class will remain elevated.
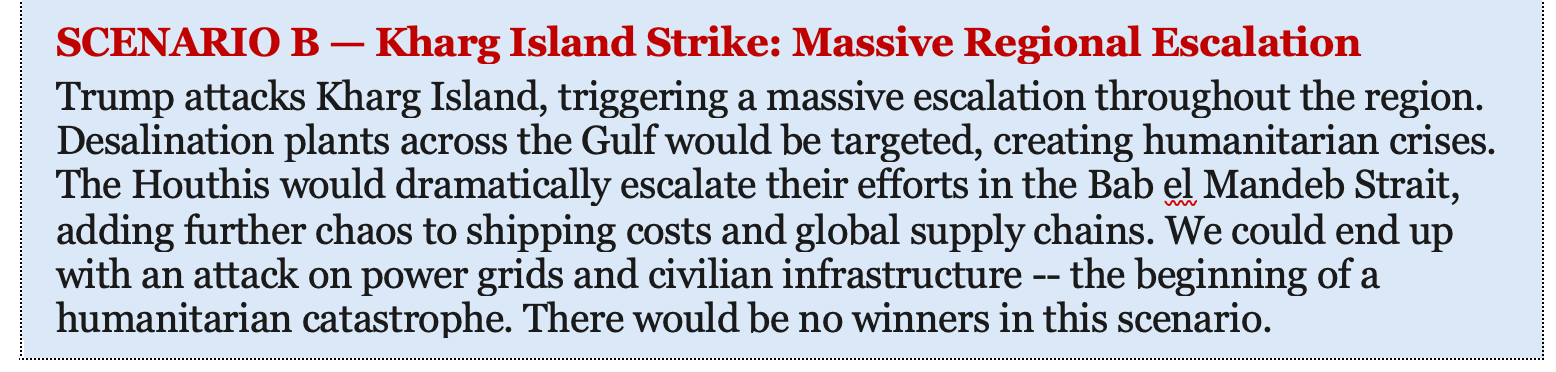
IV. The Bab el-Mandeb: The Second Chokepoint
Iran is now hinting it could block the Bab el-Mandeb Strait — one of the most strategically critical shipping lanes in the world. This Strait connects the Red Sea and the Suez Canal with the Gulf of Aden and the Indian Ocean, Nearly 9 million barrels of oil move through it every day. If this is disrupted, expect oil to surge and risk assets to be hit across the board.
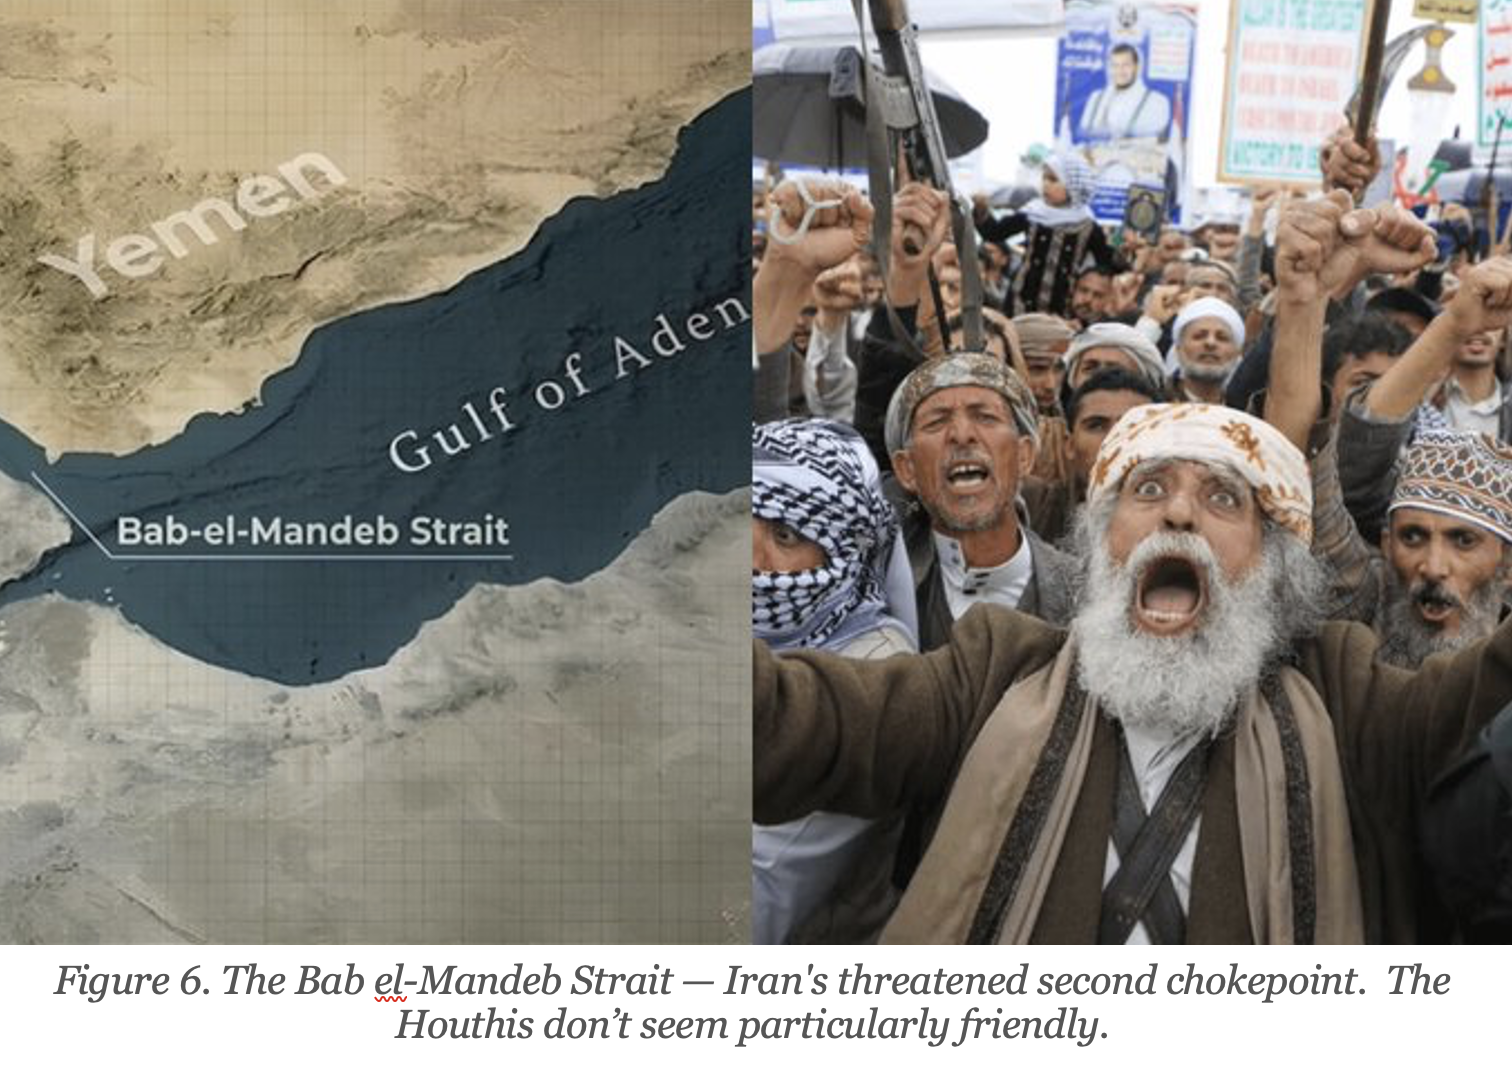
This is not merely a geographic escalation. It is a deliberate strategic signal: Iran is willing to sever not one but two of the world's most critical energy arteries simultaneously. The global economy has no contingency plan for both the Strait of Hormuz and the Bab el-Mandeb being effectively closed at the same time.
V. Probable Outcomes: A Framework for the Unthinkable
I have no idea how the United States plans to resolve the Iranian crisis, but I see a set of probable outcomes — each with profound implications for financial markets and global stability. These are not exhaustive, but they represent the scenarios that concern me most.
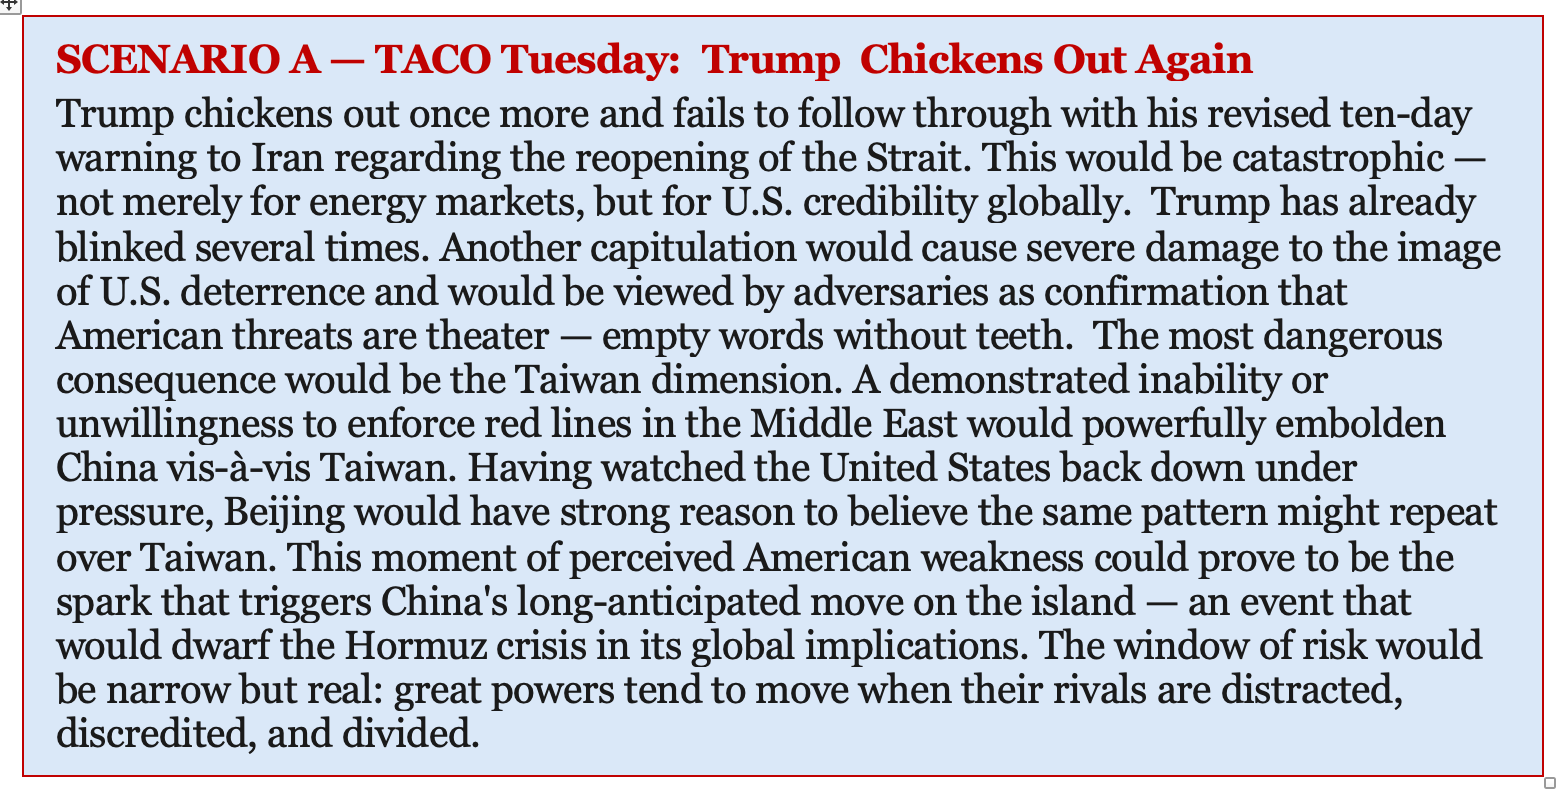
Short-term Market Action – A Bit Confusing
I have to admit that the short-term market action today is immediately puzzling. Trump’s revised warning to Iran ten days ago had a deadline of April 6 at 8pm EDT. The fact that he has shifted yet again the deadline (to April 7) suggests to some that he really has no intention to carry out his repeated threats. Although that might be bullish short term, I don’t see a positive long-term solution unless Iran absolutely caves in the negotiations, and I don’t expect that. The challenge for Trump is that Iran really has him trapped right now. If Trump wavers yet again, then his threats have less and less credibility. This in turn invites an even bigger crisis – a Chinese takeover of Taiwan.
Iran can continue to block the Hormuz and hold the rest of the world hostage. This would lead to higher inflation and eventually, the stock markets would trade sharply lower. If Trump carries out his threats, then the long-term inflationary effects will be equally devastating for many markets – maybe even more so.
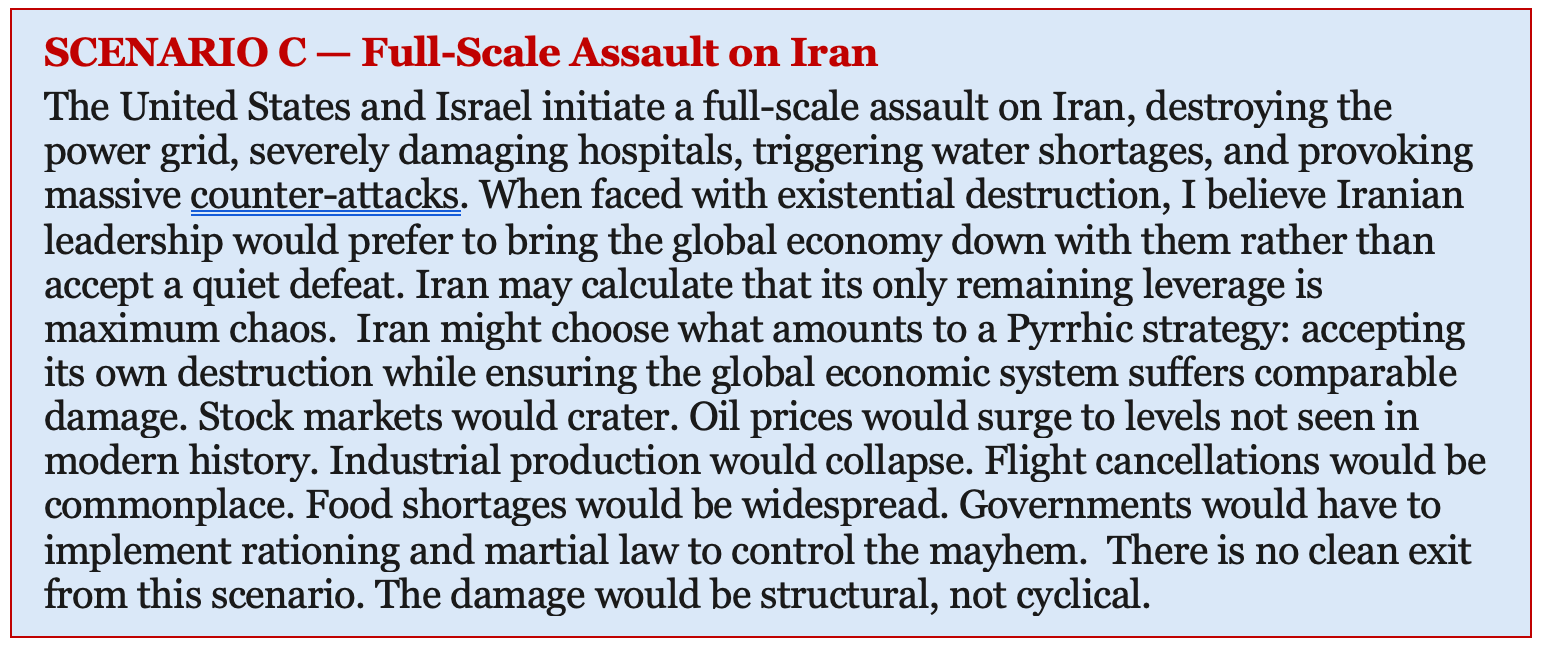
The Chinese foreign ministry summed up this situation quite well. Before the U.S. launched this war, the Hormuz was open and products were move freely. Now the Hormuz is closed, and Iran doesn’t seem to have the slightest interest in opening it. It is hard to see how the U.S. – or the global economy – comes out of this situation a winner.
There is no clean exit here. Without an unexpected positive outcome, stock markets would crater. Oil prices would surge. Industrial production would get crushed, and governments would need to implement rationing and martial law to control the mayhem.
VI. A Darker Hypothesis: The Grand Energy Stratagem
I want to float an idea that many (including myself) will find uncomfortable — perhaps even conspiratorial — but which, in the context of everything unfolding, deserves serious consideration. What if the chaotic conditions created by the Trump administration were not the product of impulsive decision-making, but were instead the result of a carefully planned strategic design?
Consider the following facts in sequence:
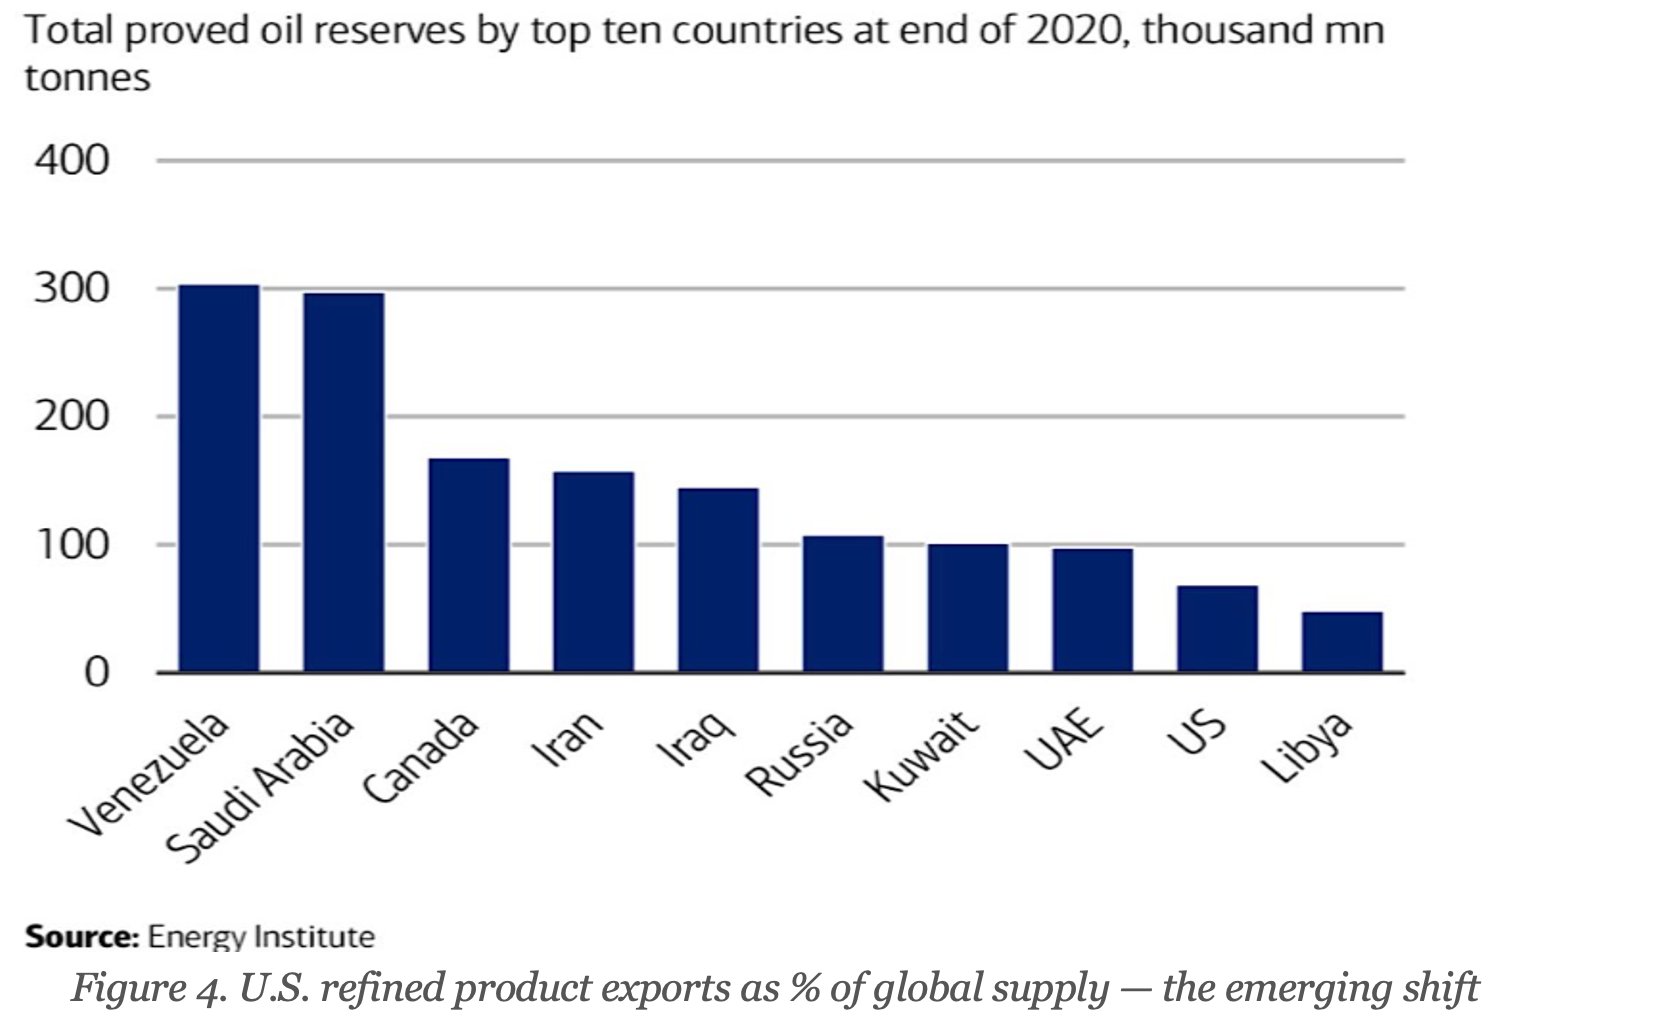
■ The United States has, in all practical respects, established de facto control over Venezuela's oil reserves — the largest proven reserves in the world — through a combination of sanctions relief, political pressure, and commercial arrangements. (Further dominion over that supply could easily be taken with further limited military intervention.)
■ The United States is now largely energy self-sufficient, producing more oil and gas than any other nation on earth.
■ American refined product exports — gasoline, distillate, jet fuel, propane — have surged in global importance precisely as Middle Eastern supplies have collapsed.
■ U.S. propane alone accounted for 53% of global exports, versus just 22% for the Middle East.
■ The current crisis has effectively cut off the primary energy competition: Gulf state producers who have long anchored global oil pricing and wielded OPEC leverage.
Now consider the strategic outcome: if the Strait of Hormuz remains effectively closed — or even significantly disrupted for an extended period — the United States is positioned to become the dominant global oil supplier by default. Add fast-tracked, rapid expansion of Venezuelan oil products to the mix, and the U.S. ensures that it remains both the world's largest consumer of energy and the world's indispensable energy exporter.
What if the chaos is the strategy? What if the United States is engineering — whether intentionally or as a byproduct of reckless belligerence — a restructuring of global energy flows that places America at the center of the system rather than the periphery?
The nefarious reading of events goes something like this: Washington understood that the moment of maximum leverage over global energy markets required a simultaneous disruption of Middle Eastern supply and the establishment of American alternatives. By presiding over a crisis that shuts down the Gulf's export capacity, the U.S. effectively eliminates its primary competition and positions itself — along with Venezuela, now under its de facto control — as the world's essential oil supplier.
The implications for the dollar would be profound. Energy priced in dollars, flowing from American and American-controlled sources, would anchor the petrodollar system more tightly than ever — at precisely the moment when the BRICS coalition and others have been working to erode it.
I want to be clear: I am not asserting that this is a deliberate master plan. The Trump administration has shown limited capacity for long-term strategic coherence. But I am saying that whether by design or by accident, the structural outcome of the current crisis could hand the United States an extraordinary degree of control over global energy markets — control that would have been unimaginable a decade ago – but it would come at a staggering cost.
Markets should not simply analyze this as a Middle East conflict. They should analyze it as a potential restructuring of the entire global energy order — with the United States and the dollar as the primary beneficiaries.
If that reading is even partially correct, the investment implications are significant: sustained higher oil prices, a structurally stronger dollar, persistent inflationary pressure in energy-importing economies, and a continued correlation breakdown between traditional safe-haven assets and the underlying geopolitical risks.
VII. Conclusion: The Stakes Have Never Been Higher
We are living through what the IEA's own Executive Director has called the greatest threat to global energy security in history. The International Energy Agency warns that around 12 million bpd of oil supply have already been disrupted — more than the entire 1973 Arab oil embargo — with no spare capacity to replace it and petrochemical infrastructure now being deliberately targeted.
The financial market implications are clear but unpriced: oil prices are very likely to remain elevated and volatile; bond markets face stagflationary pressure unlike anything since the 1970s; equities are pricing in neither the duration nor the depth of the disruption; and the dollar's role in the emerging energy order is strengthening, not weakening.
For investors, there is no safe harbor in conventional portfolio construction. The traditional negative correlation between bonds and stocks has broken down. Gold is underperforming its safe-haven mandate. The only consistent winner has been the dollar – and the dollar’s strengthening has been very modest — and the volatility itself.
I continue to hold downside option positions on equities, but my portfolio is structured to generate positive returns under nearly all scenarios. I stress-test the portfolio using extremely conservative assumptions, as I have explained previously. Under a Trump presidency, we can assume that policy changes can and will be abrupt and highly unpredictable. Therefore, I focus on trades that assume wildly unexpected moves that might only occur once in 5,000 events. Such moves are not impossible, but they are certainly improbable. Moreover, I have portfolio insurance layered in to cover the risk if we get absolutely wild market action.
In any event, I see no likely scenario in which the resolution of this crisis is bullish for risk assets in the near term, but if the market trades higher anyway, then our portfolio will do fine. Barring an unexpected peaceful resolution to the current conflict, the only question is whether the outcome is bad — or historically catastrophic. I respect the market action and the obvious resilience, but my suspicion is that eventually it breaks down sharply. I was prepared for the market to bounce, but I am open to the possibility that it just isn’t quite ready to break lower as I expect.
In any event, I don’t see any good outcomes here. There are only degrees of damage. The job of the disciplined investor is to be positioned on the right side of that spectrum, but it is possible that more patience might be required.
In the meanwhile, I want to wish you all the best of luck with your trading. For sure, these are tricky markets that are filled with enormous uncertainty.
Andy Krieger
*********************
Here are Imre’s thoughts. You will note his process is entirely different, but we often end up with the same positions. His charts are linked to each market heading:
*********************
My Framework
I treat markets as auctions, not prediction machines.
Most sessions on a day-to-day basis are balanced.
Edges form at the extremes of value.
I trade acceptance and rejection at those edges.
If value migrates, I align with it.
If it fails, I trade the rotation.
I am not in the business of forecasting.
I am in the business of validating participation.6584
____________________________________________________________________________
Last week's immediate downside target was 6357.50. The market hit it virtually to the tick. Buyers then responded and reclaimed every upside target cited in last week's analysis.
Right on cue.
This week, those upside targets become the key defense zones for buyers. The most critical is the 6483 to 6460 zone. As long as buyers hold there, the bull case remains intact.
The upside objectives are clear. First, buyers need to reclaim the 200-day moving average, currently sitting at 6682. Above that, a minor zone spans 6765 to 6780. Clear that, and the next significant level comes in at 6834.
If sellers reassert themselves and drive the auction back below 6460, the first downside target is 6357.50 — the same level buyers defended so forcefully this week. Below there, the major high volume node spanning 6214.75 to 6257 comes back into focus.
Last week highlighted exactly why the 4612 to 4661 zone matters.
Tuesday saw buyers push above it. By Thursday — the final session of a shortened Easter week — sellers tried to reclaim it. They failed. Gold closed above the zone for the second time in the week.
That kind of two-sided test is meaningful. The market probed both sides and buyers held their ground.
It remains the key battleground heading into this week.
A successful defence keeps the bull case alive. The upside target is the major distribution zone spanning 5085 to 5207 — where the original breakdown began. Reclaiming that zone would represent a significant shift in market structure.
A failure to hold 4612 opens the door to a test of 4411. Below there, the 200-day moving average comes back into play. And if that fails, the low volume node spanning 3730 to 4008 becomes the next area of interest. There is very little to slow price down in that corridor. That's worth keeping in mind.
For now, 4612 to 4661 is the number. Everything else follows from there.
Last week's upside target was $110 to $114.20. The market hit it. Right on cue.
That's three markets, multiple weeks running, targets hit with precision. The method doesn't change.
Crude has hit its target. What comes next is less clear.
The next obvious upside objective is the spike high at $119.48. That level marks the initial emotional surge that accompanied the outbreak of military conflict between the U.S. and Iran. It was an event-driven move. Getting back there would require the market to accept prices it has only briefly visited under extraordinary circumstances.
That's a high bar.
The more probable short-term path is consolidation. Don't be surprised to see the market rotate back toward the prior balance zone between $93 and $100. That's where fair value was established. Markets have a habit of returning to check in on it.
Value migrated to the upside target. The question now is whether the market can build acceptance at these levels or whether it gravitates back toward more familiar prices.
This week, crude oil is one to watch rather than trade aggressively. Let the market show its hand first.
DISCLAIMER
This report is published by Edenridge Trading LLC for informational purposes only and does not constitute investment advice. All opinions are those of Andy Krieger and are subject to change without notice. Past performance is not indicative of future results. Options trading and futures trading involv