Decoding the Current Market Paradox and What This Means for Gold
Clearly, the current situation is rare in every regard, and we need to examine it more closely in order to figure out the true macro conditions in the market today.

Last week, the equity markets continued their torrid rally. The S&Ps rallied for the sixteenth out of the last eighteen weeks. I have been reviewing data for many, many years, and it has been quite challenging to find a period that matches this one for consistency. There have certainly been larger rallies than the recent 24.4% rally, but very few periods match this astonishing level of consistency.
After the Great Recession, when the Fed was pumping enormous quantities of funds into the system, there were two particularly strong periods with very steady performance, but the consistency of the recent rally beats those periods hands down.
In August of 2010, a 31% rally started that lasted for twenty weeks, but it had five down weeks during the period. Earlier, starting in March of 2009, there was an explosive 81% rally that continued for thirteen months without any major interruptions, but this rally likewise had nowhere near the consistency we have had since last October. In fact, this huge rally at least had some corrections along the way that resembled relatively normal price action, albeit extremely bullish. In fact, the two closest periods I have found so far in terms of trend persistence took place in 2002 and 1989.
In 2002, there was a 27.8% sell-off that started in March. The sell-off continued for eighteen weeks with only three up weeks during the entire period. In terms of rallies, I had to go all the way back to March of 1989 to find a rally that approximates what we have just seen. Starting in March of 1989, we had a 22.6% rally that had only three down weeks over the next twenty-three weeks. That was an astonishingly steady rally, but that rally was not quite as robust as the one we are currently having.
In order to fully comprehend just how remarkable the recent period is, we need to have a look at the chart of Federal Reserve Discount Rates over the past 60 years. Let me summarize some of the data from the chart below:
April 1989 – the Fed started aggressively cutting rates, lowering them from 9.73% all the way to 3.13% by the end of 1992.
June 2000 – the Fed started aggressively cutting rates, lowering them from 6.5% all the way down to 1% in September of 2003.
July 2007 – the Fed started aggressively cutting rates, lowering them from 5.25% all the way to .15% by December of 2008. The Fed essentially left rates near 0% until 2015, when they finally started to nudge rates higher. They pumped trillions of dollars into the system during this period following the Great Recession.
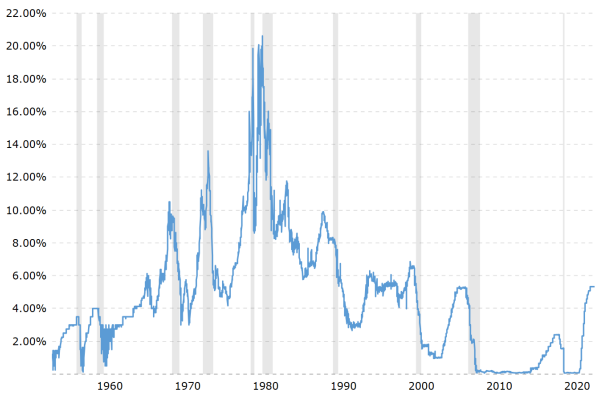
What is fascinating about the recent rally is that it stands out like the proverbial sore thumb. Every prior example of highly persistent stock rallies occurred either during, or at the tail end of, aggressive interest rate cuts that were coupled with huge injections of liquidity into the system by the Fed. The current rally – in fact the rally since January of 2023 is an absolute anomaly in that it has occurred during a tightening cycle when interest rates are theoretically restrictive.
Clearly, the current situation is rare in every regard, and we need to examine it more closely in order to figure out the true macro conditions in the market today.
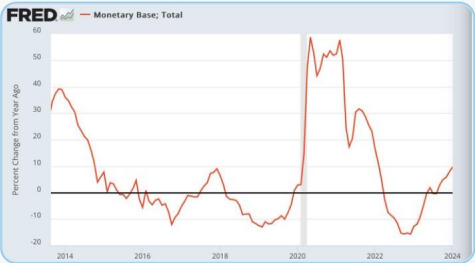
As you will see in the next chart, the Fed’s balance sheet exploded between February 2020 and June 2020, when it grew from roughly $4.1 trillion to $7.1 trillion. It currently stands at $7.6 trillion, so the very obvious point is that the Fed’s “quantitative tightening” since the beginning of 2022 has been a master class in deception. Yes, the balance sheet is smaller than it was at the height of Fed-mania, but we are certainly not restrictive in terms of the sheer volumes of Fed reserves in the system relative to where we were before Covid. Moreover, if we look at this data in light of strong economic growth and full employment, then we have to seriously question what the Fed is really trying to accomplish.
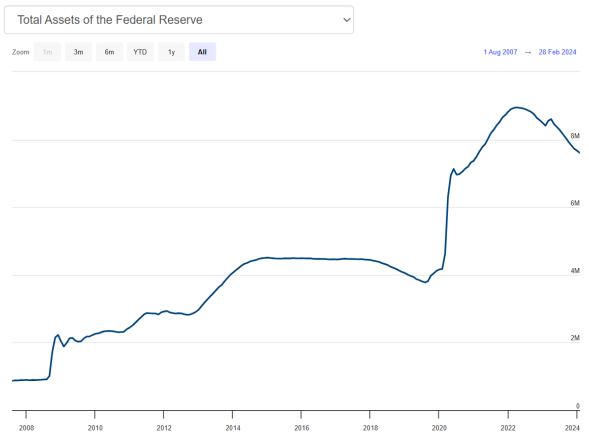
The massive injections of liquidity clearly helped the economy enormously, and the economy has continued to grow at a rapid pace. Consumer spending has remained strong despite some worrying numbers regarding consumer debt levels and loan delinquencies. Likewise, the economy is absorbing quite well so far, the awful state of commercial real estate. Employment levels are full, and wage growth is still very strong. Housing prices are holding up despite 7% mortgage rates, and we are now seeing some very sharp increases in oil prices. Bottom line, it looks like inflation is here to stay, and it is premature for the Fed to declare victory on that front.
Moreover, there are other signs in the economy that monetary conditions are in fact extremely loose, despite the Fed’s protests to the contrary. Aside from the surging stock market, gold is doing exactly what I have forecasted by rallying sharply. Bitcoin, another proxy for money, has exploded higher, and a number of other commodities are surging higher as well. This sort of market action is absolutely inconsistent with tight or restrictive monetary conditions. So what is happening that can explain this paradox?
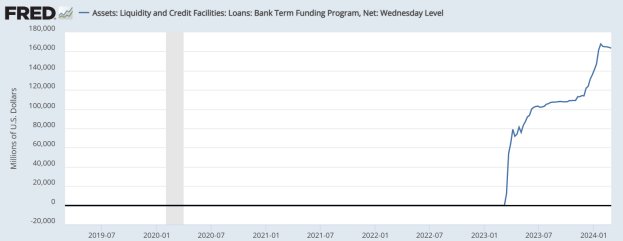
First of all, the Fed has managed to sneak a huge amount of extra liquidity into the banks through its Bank Term Funding Program. BTFP was the Fed’s way of pumping money into some weak banks which were on the verge of collapse in 2023. The program ends on the 11th of March 2024, but the Fed will continue to offer support to eligible banks through the Discount window.
There is something far uglier going on, however, and the authorities are careful to avoid most discussions about it. New York University school of business, the Stern School, prepared a draft paper that suggested the unrealized losses on bank credit could be as high as $1.7 trillion, a number that frighteningly close to the total bank equity in the US of $2.1 trillion. The study included loan data, portfolio holdings, and so forth.
The banks have this wonderful scheme that allows them to carry hundreds of billions of dollars of losses from assets on their books without negatively impacting their capital standing by declaring these underwater assets as “Held to Maturity.” What a great scheme!! Just pretend the losses aren’t there and carry on your business as normal. Make sure the authorities don’t talk about it lest they alarm the depositors. Just keep this information as quiet as possible.
Of course, the Fed wants to use every opportunity to reduce rates, or at the very least, tell the world that everything is fine! They know full well how bad the true balance sheets of the banks are, and they know that only two things can heal the mess: time and lower interest rates. They even have interesting code words when they discuss the markets. Data which shows that inflation is still very much alive is classified as “noise,” while data that supports their agenda by suggesting inflation is headed lower is “good.” If you go back and read some of the comments of the various Fed officials, you will note this pattern. In a way it is comical. In another way, it is terrifying. The Fed also has well over $1trillion of losses on their own balance sheet, so they are fully on board with this process of deflection.
Some banks have come out with studies suggesting that the total unrealized loss number among the commercial banks is closer to $700 billion, but their studies were biased and incomplete. I think that number is intentionally understating the magnitude of the problem. It might not be surprising to learn that one of the banks in the news lately, New York Community Bank, has been on the “watch list” of banks with large unreported losses. It is hardly surprising that the share price of this bank is down about 75% over the last year.
The Fed has used all sorts of other tricks to keep the system liquid even while pretending to tighten monetary policy. It is true that the Fed’s balance sheet has been reduced by about $1.3 trillion from its peak level, but a huge percentage of that reduction has been offset by the pumping of funds into the banks via reverse repo mechanism. Many money market funds had parked a lot of money at the Fed – about $1.4 trillion -- and these funds have been largely drawn down over the past year and placed in banks, essentially sterilizing the Fed’s relatively modest amount of quantitative tightening. Remember, the Fed’s balance sheet is $3.5 trillion LARGER than it was at the start of 2020!!
There is yet another game going on, and that involves the Treasury Department coordinating with the Fed on the messages they send out about the economy. The Treasury Department is issuing a staggering amount debt despite the strong economy. Previously the Fed bought their debt, but private sector investors are buying the paper now. The Treasury Department is headed by a very savvy economist, Janet Yellen. Yellen served as the 15th Chair of the Federal Reserve Board, led the White House Council of Economic Advisors, taught at Harvard, London School of Economics, and University of California, Berkeley, and got her PhD in economics from Yale. She knows very well what is really happening in the global economy, and she understands the true state of inflation, Federal debt, and bank balance sheets.
She was very clear ten years ago when she said the path of Federal deficits was unsustainable, but she is spending money at the Treasury now like we are in a financial crisis of nearly unprecedented proportions. Why? She is a brilliant economist, so clearly she knows something about the economic system that is very ominous. Otherwise, she would never condone this spending. The whole situation is puzzling, and frankly, it is disturbing.
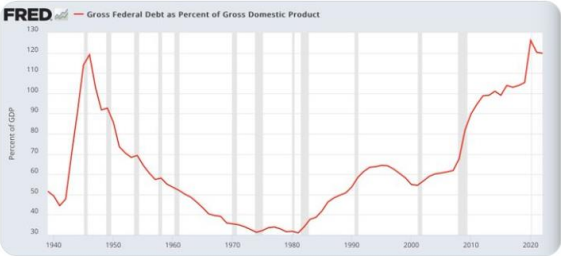
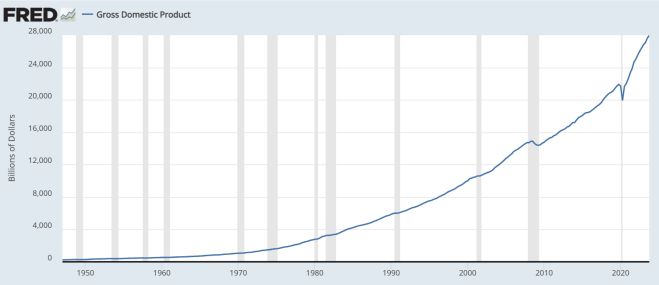
US debt has increased by another $3 trillion since Q1 2023, and we have $1T in new debt every 100 days!! Talk about an unsustainable path! The US economy has to grow, or it is going to get bulldozed by a debt behemoth that is growing out of control. The debt levels of World War II, which we are now matching, were followed by a baby boom that allowed the US economy to grow into its debt levels.
We are highly unlikely to have a comparable baby boom now (unless we have a dramatic shift in our immigration policy), so the US has to perform a near economic miracle over the next ten years. Innovation can help, and AI will play an important role, but the sheer magnitude of this debt, and its current pace of acceleration is outright terrifying. I don’t know what the tipping point might be, but there could very well be a point at which investors say, “no más,” and start demanding a hefty premium for US debt in the form of much higher interest rates. So far, Armageddon has been forestalled, but the authorities need to be careful.
Please understand that I am a strong proponent of deficit spending as a stimulus tool when the economy needs a boost. During periods of strong economic growth, however, I feel that deficit spending is irresponsible. It is during times of abundance that governments should shore up their balance sheets, not spend at unprecedented rates.
So how does this all play out? Well, I don’t expect the US authorities to suddenly start acting fiscally responsibly, so I stick to my oft-stated forecast for a much higher gold price. I have been touting this idea since it was trading at $1820 per ounce, and I had advised profit-taking on at least some of the position when it rallied up above $2060. I have since recommended the rebuilding of the full exposure on the dip below $2000. Going forward, I think that gold is likely coiling for a rally above $2300 towards $2435 per ounce. This move will take some time, so I advise either playing for this move with longer dated options, or otherwise using price dips to try to capture smaller moves along the way. Gold is the ultimate currency, so it is almost inevitable that it will rise against currencies that are following irresponsible policies. That includes the dollar and most other major currencies as well.
Silver is potentially going to do a big catch-up, and break through some strong, long-term resistance and break above $25.50 en route to $30. There are some very attractive option strategies for gold and silver that would yield spectacular returns if these moves play out as expected. Frankly, even if they only develop in a smaller way, the returns with some clever option strategies would still be exceptional.
I have had a similar view about Bitcoin, which is sort of a modern-day proxy for gold. At current levels, however, I feel that Bitcoin needs to correct a bit before making a sustained move to all-time highs.
Clearly, stock markets have morphed into casino-like entities for the time being, so as long as there is a surplus of liquidity in the system, momentum-based plays will rule the day. This will be both on the upside and downside, so don’t get lulled into thinking that momentum movements can only go higher. There will be a dramatic correction at some point, and although that will likely be a buying opportunity for a longer-term investment, the move lower will be a great trading opportunity. In certain ways, the chart below really sums up the sell-off in stocks in 2022 and the subsequent rally since the beginning of 2023.
In my next write-up, I am going to focus on currencies, as the recent action is starting to get my interest. I was hoping dollar yen would spike above the multi-year highs at 151.95, as that would give me a nearly perfect entry to buy low delta yen calls against a basket of currencies. There are also some limited risk spread trades that I want to initiate. The problem is that there seems to be a wall of sellers lined up below 151.00 in dollar yen, and I might not get the final pop higher that I was hoping for. Accordingly, I am likely going to start gently scaling into my positions, but I am still fine-tuning my strategies.
Aside from the yen, there are some very interesting things happening with the Canadian dollar, the euro, the Swiss franc, and the British pound. The moves that I am anticipating are multi-month trends, so we have time to get on board.
Until then, I wish you all the best of luck.
Andy Krieger