Does This Pattern Suggest a Sharp Correction in Stocks?
Some of the current valuations also remind me of the dot-com bubble in 2000. Markets always seek balance, so parabolic rises are nearly always reversed quite dramatically.

In this article:
- Exploring the possible bubble conditions in the 'Magnificent Seven'.
- A closer look at Nvidia (NVDA) and Apple (AAPL).
- Comparing this situation to other extreme overvaluations.
- The recurring pattern that may present an opportunity.
- Potential trade opportunities for the yen.
Thoughts on the Market - February 11, 2024
Last week I noted that at some point I would be placing a large, limited-risk option bet to play for a massive downward correction in the Nasdaq due to its extreme overvaluation. The challenge of timing this play is not an easy one, and my analytical process to arrive at that decision is complicated. The decision is all the more complicated, however, when it comes to analyzing bubbles, as they can persist longer than we can rationally expect and extend to levels way beyond what we may have thought were sensible. In the immortal words of the great economist, John Maynard Keynes, “Markets can remain irrational longer than you can remain solvent.”
The higher the stock markets goes, the more interesting I find it from a valuation perspective. The market continued its rally last week, adding another 3% to its recent gains, and this type of market action simply gets me even more focused on the coming opportunity. The bubble conditions keep expanding and the valuations keep getting more strained. The supermajority of the gains over the past thirteen months have come from the massive returns of the Magnificent Seven. I will address this shortly, but first I want to point out my mixed views regarding this bubble.
On the one hand, I am a strong adherent to the value of solid fundamental and macro analysis of markets and economies. On the other hand, I believe in the power of trends and momentum in markets. I have run trend following systems since the early 1990’s, and these systems have made excellent profits over time. They aren’t perfect, of course, but they have significantly outperformed all other benchmarks. The current situation is no exception, as our trend following system has largely nailed this insane stock market rally even as I grew more and more skeptical about its sustainability.
Our model is heavily weighted towards individual stocks due to their extremely high measures of autocorrelation, but we also include a basket of currency pairs, global stock indices, some commodities, and some fixed income markets. We adjust our weightings to account for different levels of volatility, and we go short when we get sell signals. To that extent, I am relaxed about catching the down move in stocks once they reverse, but from a purely discretionary perspective, I want to jump on board the reversal with a big option play once it is time. I like earning steady profits from the trend following activities, but I love earning periodic outsized returns from limited risk option strategies which capture major shifts in the markets.
From the low at the beginning of 2023 through the close on Friday, February 9, 2024, the Nasdaq has rallied more than 68%!! The rally has been heavily concentrated in the Magnificent Seven stocks, with these huge companies creating a large distortion in the stock market valuations. As I noted last week, the broader index has not participated in this move to anywhere near this level, and the magnitude of this distortion is very rare.
To some extent this distortion can be attributed to the enormous quantities of funds that have gone into the stock market via passive investment strategies. Because the passive investment strategies typically seek exposures to the different indices, the mega-capital stocks will by default naturally receive the largest capital allocations of the passive investments. This in turn drives the mega-capital stocks – the so-called Magnificent Seven – to ever more distorted levels, pushing them further and further from any sensible valuation measure.
Additionally, we have a market that is driven by themes or narratives that have fueled massive speculative capital flows into technology plays, with a heavy emphasis on artificial intelligence and the expected enormous productivity gains which we expect it to deliver over time. The degree to which the market is likely getting ahead of itself might be best typified in the case of Nvidia. This company has 26,000 employees and it had about $27 billion in earnings last year.
The company is thirty years old, it is profitable, and its technology is first rate, but does it make sense that the company has a valuation of $1.78 trillion – a valuation that is almost as big as the GDP of Brazil or Canada or Mexico?
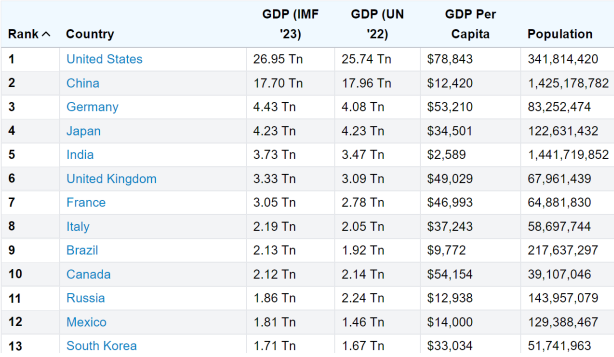
Sure, Nvidia is a dominant supplier of AI hardware and software, and its GPUs are used in workstations for various applications such as manufacturing design, media, automatic, scientific research, and engineering. I seriously question, however, whether it is going to continue to expand its operations without serious competition in the coming years. There is a great advantage in being a first mover, but it is almost inevitable that it will face stiff competitors over the coming years. Moreover, is it sensible to conclude that the expected improved efficiency of AI will develop without some serious missteps along the way?
Nvidia’s PE ratio is currently above 95!! Yes, that is right. It is above 95. Apple and META, for example, have PE ratios around 30. Tesla’s PE ratio is at 45. An awful lot of things have to go really well for a long time for Nvidia to grow into a company that justifies the current bubblelike valuations.
In a way, the absurdity of these valuations reminds me of the bubble conditions in Japan in 1989. At the time, the emperor’s palace grounds in Tokyo had a higher valuation than all of California. It was absurd, but it wasn’t until the Nikkei bubble finally burst in 1990 that the insanity of that overvaluation returned to a more reasonable level. Although dramatic overvaluations can persist for years, and move to levels once thought inconceivable, there will at some point be a correction to the insanity. Either the fundamentals will eventually justify the valuations, or the market will have a rude awakening and correct aggressively lower.
Some of the current valuations also remind me of the dot-com bubble in 2000. Markets always seek balance, so parabolic rises are nearly always reversed quite dramatically. Remember, the insanity of crazy market valuations can also work with companies and markets that become dramatically undervalued. It is not a one-way street by any means.
Part of the challenge of trading is to put one’s ego on the sidelines and follow carefully constructed and laid out rules. These rules must address everything from trade selection processes to position diversification and risk management. This is easier said than done for a host of psychological reasons, so it is critical that speculators define beforehand their trading rules and strategies, with a particular emphasis on risk management. Please note that I am careful to point out that overvaluation in and of itself is not a sufficient reason to go short an instrument or an asset class.
It will be instructive to consider some of the following charts from the Nasdaq bubble in 2000. First, have a look at the chart of Cisco Systems.
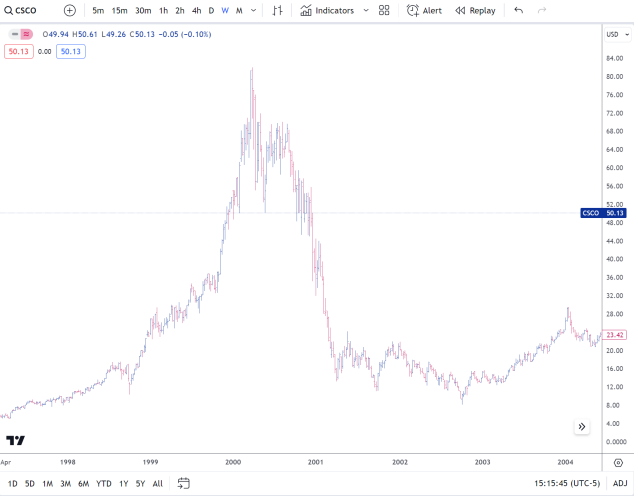
Here you can see the parabolic rise of Cisco Systems, and its subsequent collapse. After nearly twenty-four years, Cisco’s share price still hasn’t recovered to its high stock valuations in 2000.
Next, have a look at Apple’s stock during the dot-com bubble period.
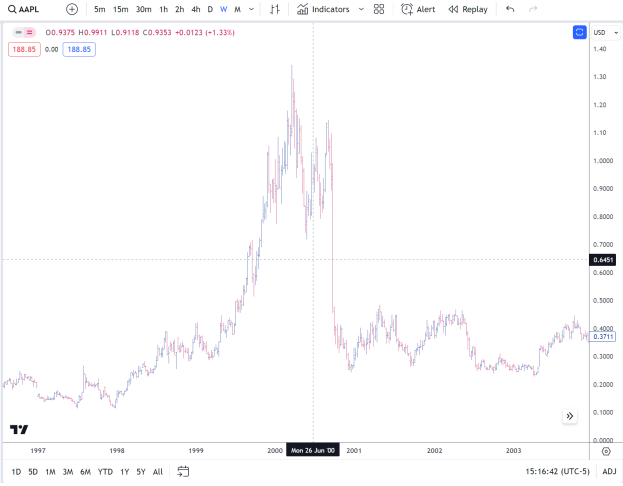
From this chart you can see the parabolic rise and subsequent collapse of Apple shares. As is nearly always the case, the parabolic rise reversed its rise with an offsetting crash, although in the case of Apple, its original extreme valuation proved to be ultimately justified when it recovered to new all-time highs five years later. Since then, Apple has continued to generate massive profits and climb to higher and higher valuation levels, recently reaching a valuation of $3 trillion. The point to bear in mind, however, is that even a remarkable company like Apple will periodically have vicious reversals to correct excessive, shorter-term bubble-like conditions.
We can see this pattern playing out again in Apple shares during the Great Recession.
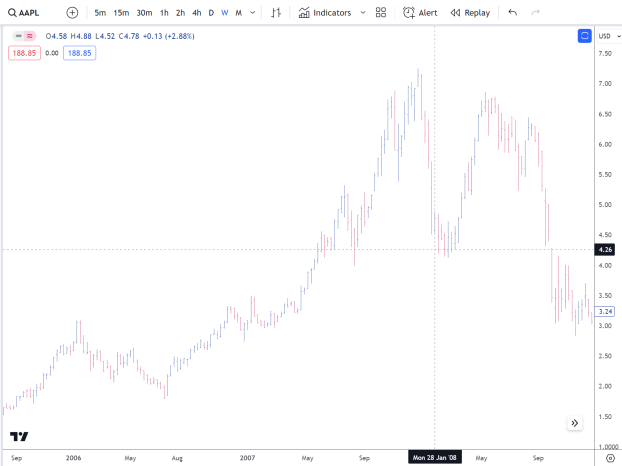
Then again, we can see this same pattern repeating in a fierce correction in 2012/2013. Yes, this pattern keeps repeating over and over, even with a powerhouse stock like Apple.
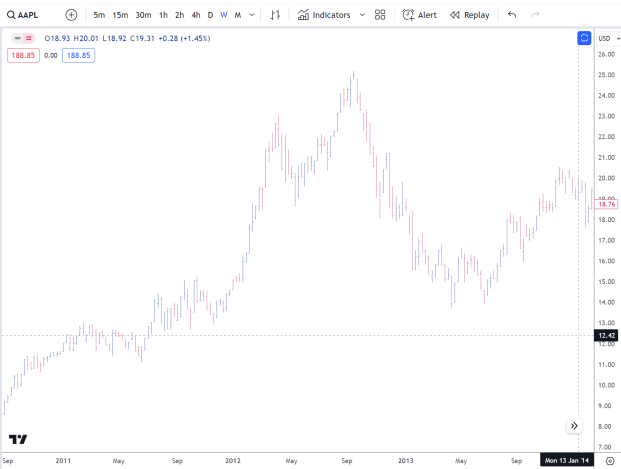
So, is it unreasonable to expect a very sharp price correction at some point in most stocks after a parabolic rise – even from a great, proven company like Apple? Even with strong earnings and decades of performance, Apple is not immune to normal market price patterns.
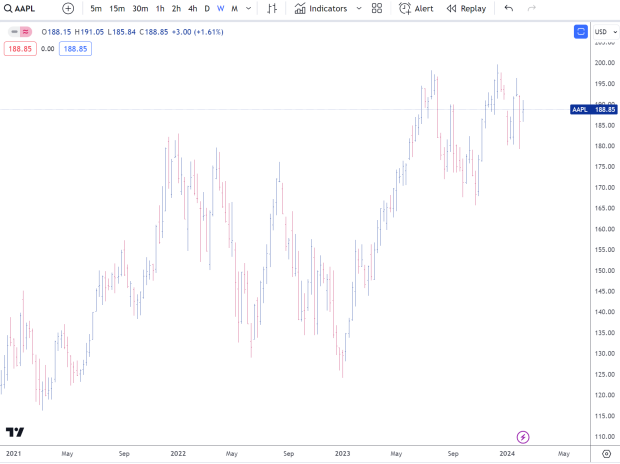
Looking at the chart below, I have to wonder whether Apple is starting to set up for yet another one of its reversals after a parabolic rise such as the one we have seen since the beginning of 2023. I don’t think the sell-off at the end of last summer was sufficient to correct the entire rally, so I would maintain that we need to be open-minded about another sharp sell-off to follow. The challenge is to figure out the level from which it will start, as well as its timing.
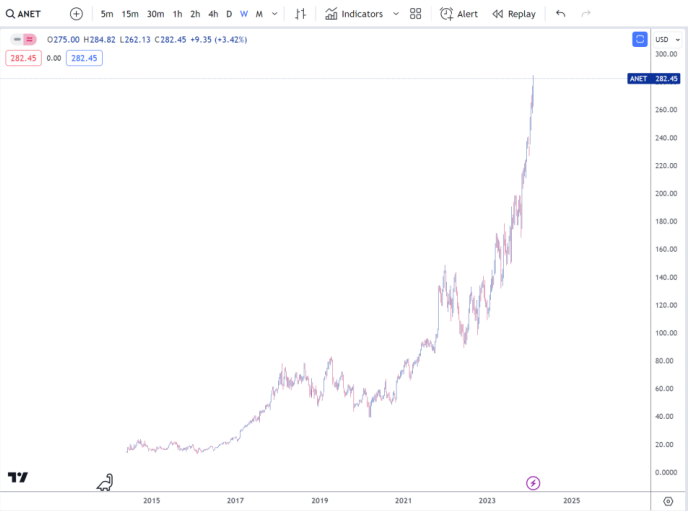
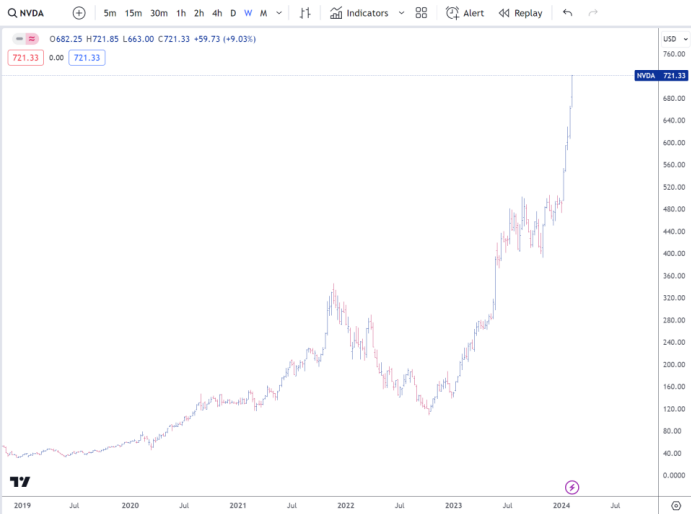
Now have a look at the charts of Nvidia and Arista Networks. Their charts show the same parabolic rise that we have looked at in companies like Cisco and Apple (multiple times). Will their fate be different? Will they be among the only companies immune from this corrective pattern that so frequently plays out after markets go into parabolic launches? If anything, their vertical rises are more extreme than the examples of Apple and Cisco. In fact, with a high probability one can say that the question regarding them having dramatic price corrections should be when, not if.
I will now provide one more example of a company that looked nearly invulnerable, until it wasn’t.
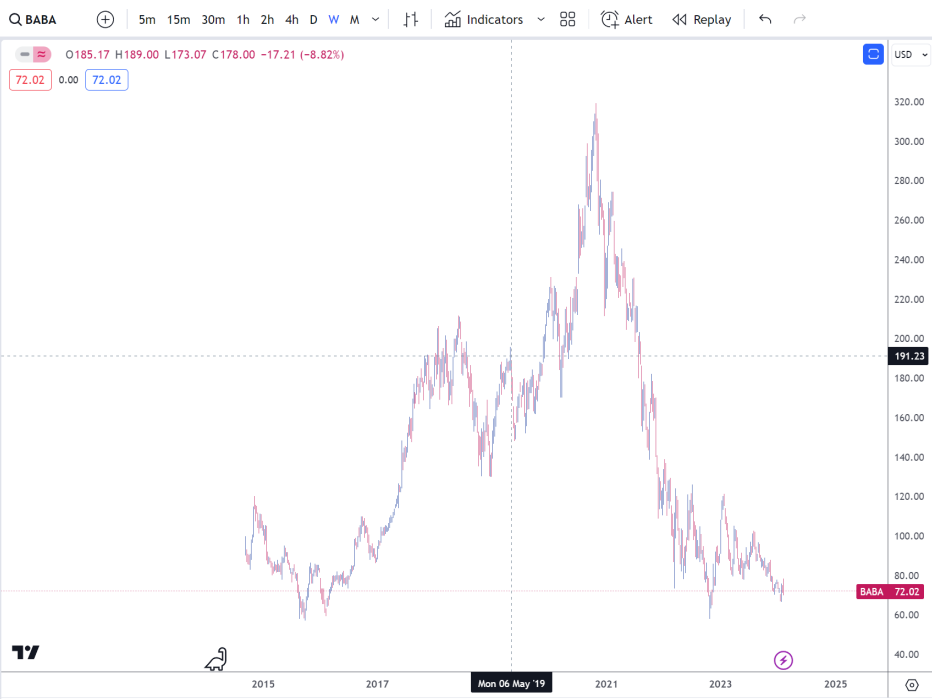
Alibaba’s fall from grace was dramatic. Yes, there were a variety of fundamental reasons that led to Alibaba’s stock sell-off, but perhaps there is something else happening in the market which leads to these aggressive price declines after parabolic rises. It seems to occur with such regularity, regardless of the specific fundamentals of the companies and markets, that we need to be open-minded to the idea that markets truly have a self-correcting mechanism at play. No, the timing is difficult to master, but the patterns are so repeatable over long periods of time, that we must be open-minded about what underlying forces might be triggering these moves. Plus, these patterns are in no way limited to stocks. They occur in nearly every market over and over again.
Aside from the strange distortions that have resulted from the enormous allocations to passive index investments, there are of course other factors driving the surge in stocks. In particular, it is important to watch the levels of bank reserves. Through the end of last week, bank reserves in the US have increased by almost $440 billion since the start of the year. Not only has the Fed’s quantitative tightening not resulted in tighter monetary conditions, but there has in fact been a significant easing of monetary conditions. There have been liquidity proxies that have loosened monetary conditions, and these looser conditions have helped fuel the stock market rallies. How this plays out going forward is complicated, but easing monetary conditions is hardly what the Fed needs right now in order to keep a lid on a resurgence of inflationary pressures. It is simply premature. We will revisit this topic over the coming weeks, but it is sufficient to say that there is a lot more to monetary conditions than just Federal Reserve operations.
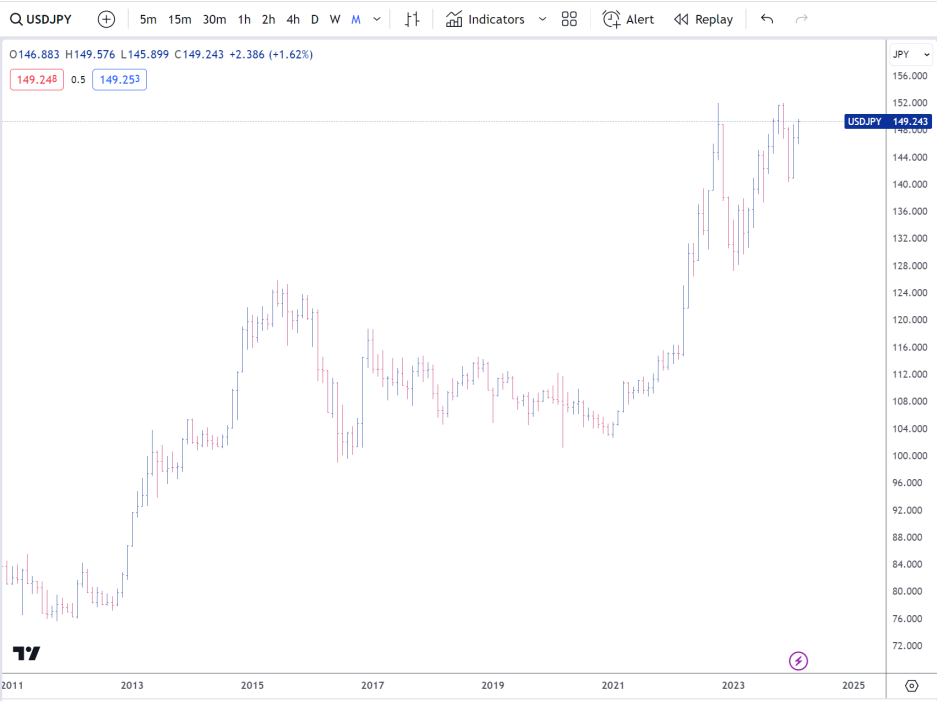
I want to quickly shift to the world of currencies, where we have experienced an extreme compression of volatility in the markets for many months. The one exception has been the action in dollar-yen, which had a relatively sharp sell-off in December, before subsequently rallying back up in January. These market moves weren’t particularly large by historical standards, but the compression we have been going through has been extreme. Therefore, these moves have seemed significant. Looking at the following chart, however, one can see the types of volatility that USD/JPY can experience once it is really moving.
Have a look at the following grid of volatilities in the various currency pairs. Compared to individual stocks, currencies are outright sleepy. For example, at the money Tesla and Nvidia options in the three-month period trade at roughly 50%. That is dramatically higher than the levels you can see in the currencies.
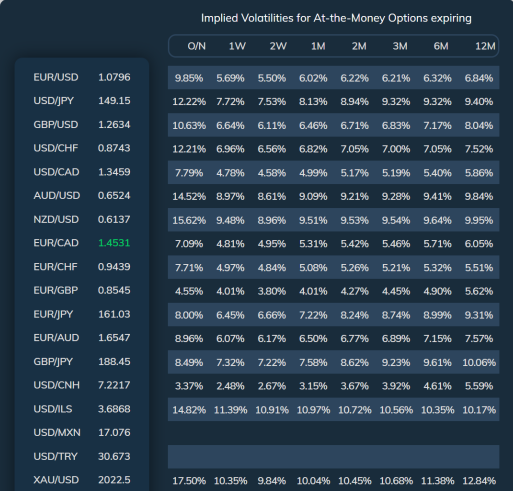
It is important to note that the current volatility levels of nearly every currency pair are way below long-term averages, particularly in the shorter dated options. Just as markets seek balance in price, they also seek balance with regard to levels of market movement and volatility. This means that after extended periods of extreme compression relative to long-term averages, we nearly always experience markets with heightened levels of movement that far exceed the long-term averages.
Accordingly, I believe that we are gearing up for a period of hyper-volatility across nearly all of the currency pairs. It might not start for several months, but it is likely to be coming before too long. This pattern has held since the free float of currencies in 1973, and it is unlikely to change any time soon. Currencies tend to have certain long-term levels of movement, and these levels are quite persistent.
Bottom line, although things seem boring now with most of the currency pairs moving in slow motion in compressed ranges, we need to be prepared for some wild times. I still think that overall, the next major move will be marked by extreme yen strength, but it is not quite time to load up the truck and put on a massive bet. Moreover, volatilities are so cheap, that we could easily put on some simple long volatility bets without a significant directional bias and still generate some good returns based on the sheer size of the coming moves, regardless of the direction.
If I were to guess as to the likely triggers for the move in the yen, I might suggest that the eventual shift could be as simple a thing as an unexpectedly strong market reaction to the Bank of Japan finally ending its negative interest rate policy. It might also be something unexpected like a terrorist attack in the United States, or perhaps a shock development in the Biden Trump presidential election. The fact is that over time, the market patterns seem to have a life of their own, and the triggers almost seem like post facto excuses to justify and explain the movement. I will address this topic further in a future update.
In the meanwhile, wishing you all the best of luck in the markets.
Andy Krieger